
Solar Net Metering Financial Calculator
202625-year projections · NPV · IRR · PDF export · Scenario manager
⚙️ System Inputs
📁 Saved Scenarios
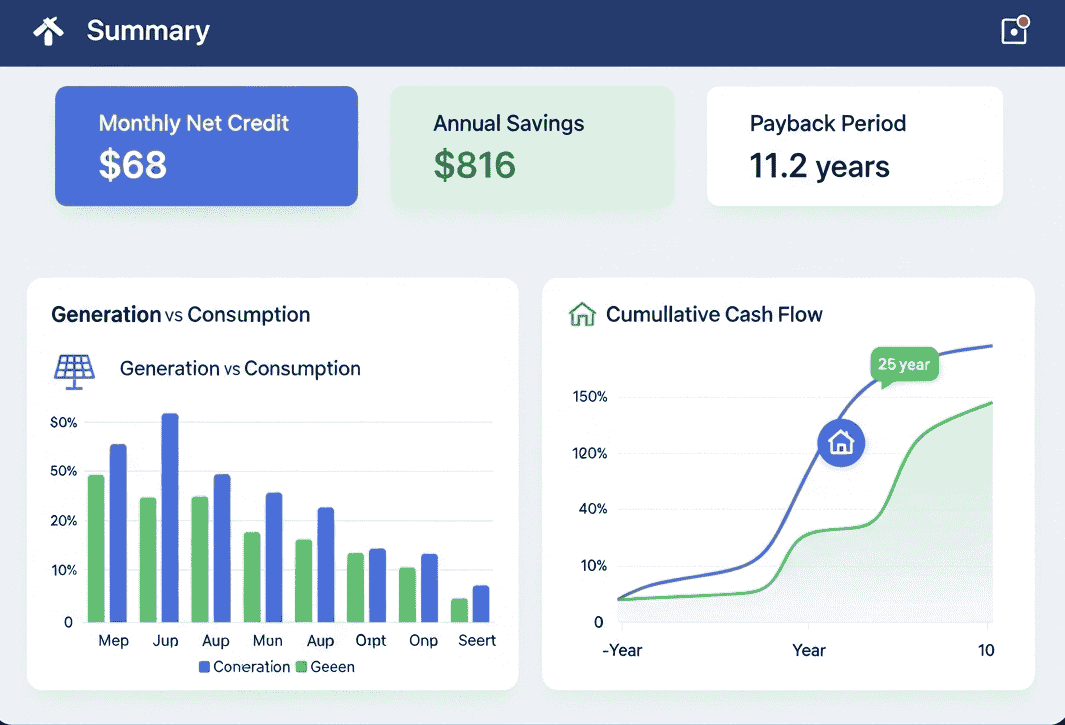
📊 Monthly energy balance
📈 25-year cumulative cash flow
📋 25-year financial projection
| Year | Generation (kWh) | Consumption (kWh) | Exported (kWh) | Imported (kWh) | Year Net | Cumulative Cash |
|---|
💡 Optimization hints
- Run the calculation to see automated hints.
12-month seasonal profile
Enter relative monthly multipliers (average should be ~1.0). Applied to both generation and consumption.
Discover how to analyze 25-year ROI, payback periods, NPV, and IRR using a solar net metering calculator. Free tool with PDF reports for homeowners and solar installers worldwide.
Why You Need a Solar Net Metering Calculator Before Installing Panels
Installing solar panels is one of the biggest financial decisions a homeowner makes. Yet most people commit to a $6,000–$20,000 investment without ever modeling the real numbers. They hear about “energy savings” and “going green” but cannot answer critical questions:
- When will I break even on my solar investment?
- What is my actual solar panel return on investment (ROI)?
- How much will I save in electricity bills over 25 years?
- Is a larger system or battery storage worth the extra cost?
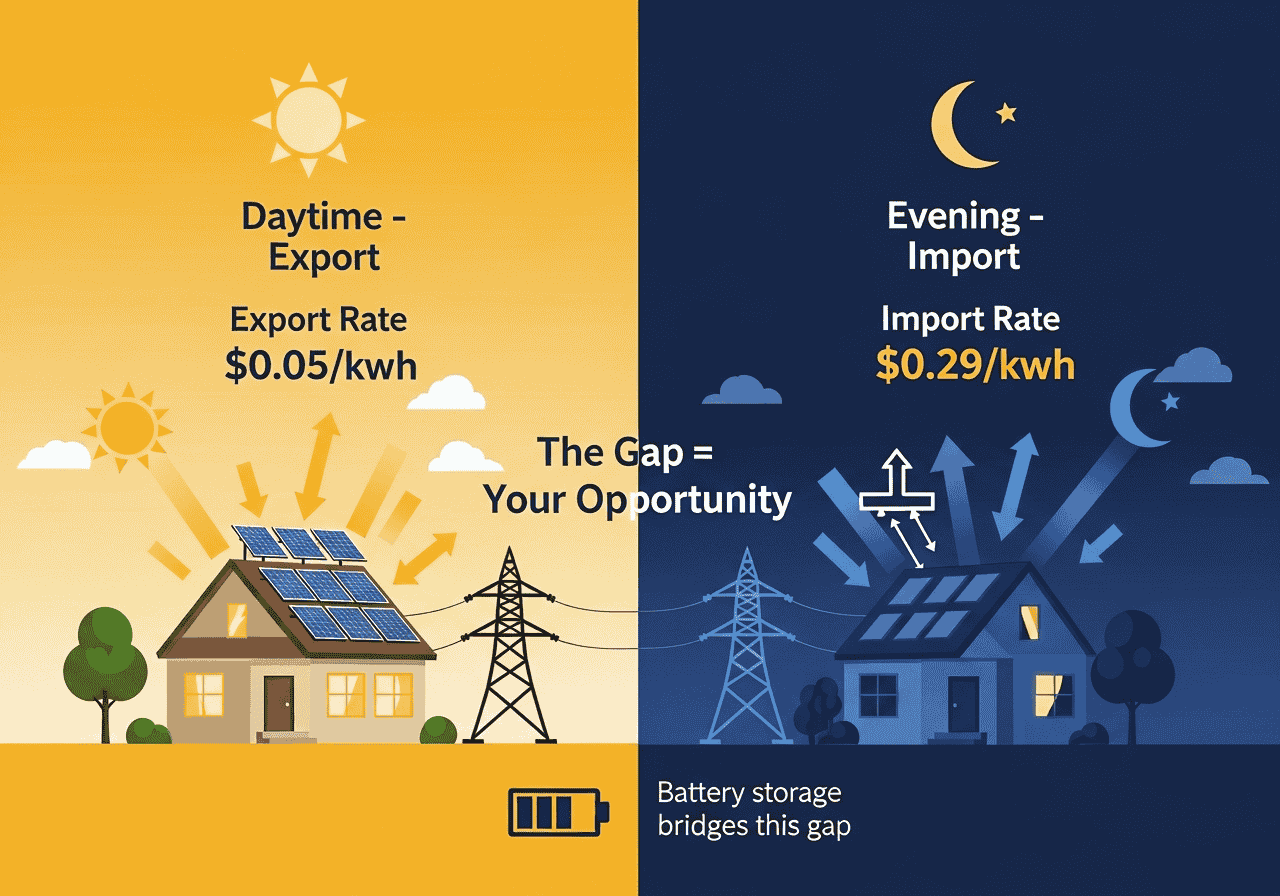
That is exactly where a solar net metering financial calculator becomes indispensable. Net metering is the grid-tie billing arrangement where your utility credits you for surplus solar electricity exported to the grid. In California, the export tariff is around $0.05/kWh while the import tariff is $0.29/kWh — a 5.8× spread that dramatically shapes your solar payback period and overall ROI.
This free solar energy savings calculator models 25 years of cash flows, accounts for panel degradation and electricity price escalation, and shows the precise year you recover your investment. The difference between a smart solar investment and an expensive regret almost always comes down to running the numbers first.
What Is Solar Net Metering and Why It Matters for Your Electricity Bill
Net metering (also called net energy metering or NEM) is a solar incentive policy where your utility company credits you for the surplus electricity your photovoltaic (PV) panels generate and export to the grid. When your system produces more power than you consume — typically midday on sunny days — the excess flows back through your smart meter, effectively running it in reverse.
The critical financial reality most homeowners miss: export rates are almost always lower than import rates. Sometimes dramatically lower. This export-import tariff gap defines the economics of every grid-tied solar installation.
Export vs Import Rate Comparison by Region
| Region | Export Rate (kWh) | Import Rate (kWh) | Rate Spread | Self-Consumption Priority |
|---|---|---|---|---|
| California (NEM 3.0) | $0.05 | $0.29 | 5.8× | Critical |
| Texas | $0.03 | $0.14 | 4.7× | High |
| Germany | €0.10 | €0.35 | 3.5× | High |
| Australia NSW | A$0.07 | A$0.28 | 4.0× | High |
| UK | £0.06 | £0.25 | 4.2× | High |
| Pakistan | Rs0.04 | Rs0.20 | 5.0× | Very High |
| India | ₹0.04 | ₹0.09 | 2.3× | Moderate |
How the Solar Net Metering Financial Calculator Works
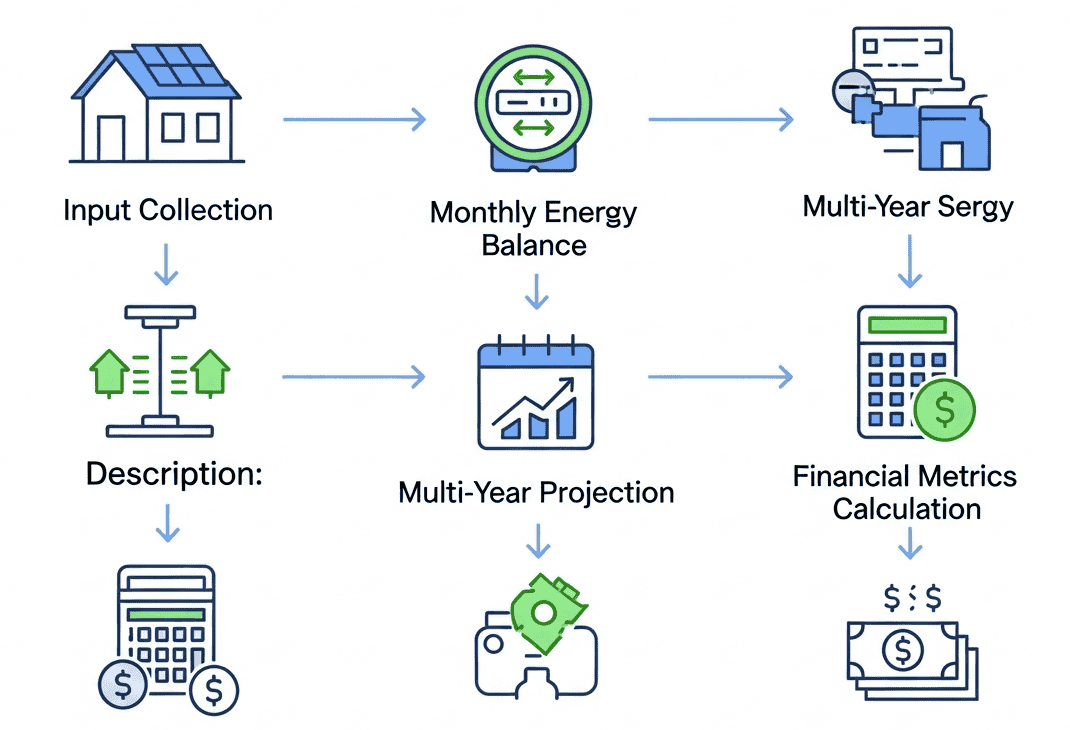
The calculator uses three interconnected computational engines to produce accurate 25-year financial projections for any grid-tied solar PV system.
Engine 1: Monthly Energy Balance Model
For each month the calculator determines the exact split between self-consumed solar, exported surplus, and imported grid power:
Imported Energy = MAX(0, Consumption – Generation)
Monthly Net Credit = (Exported × Export Rate) – (Imported × Import Rate)
When the 12-month seasonal profile feature is enabled, the calculator applies normalized monthly multipliers to reflect real-world solar generation patterns — lower in winter, higher in summer for northern-hemisphere installations.
Engine 2: Multi-Year Projection with Degradation & Escalation
For each of the 25 projection years, two compounding factors are applied simultaneously:
Tariff Escalation Factor (electricity prices rise over time) Escalation Factor = (1 + Escalation% ÷ 100) ^ (Year − 1)
Year Net Savings Year Net = Base Annual Net × Degradation Factor × Escalation Factor
Engine 3: Financial Metrics (NPV, IRR, Payback)
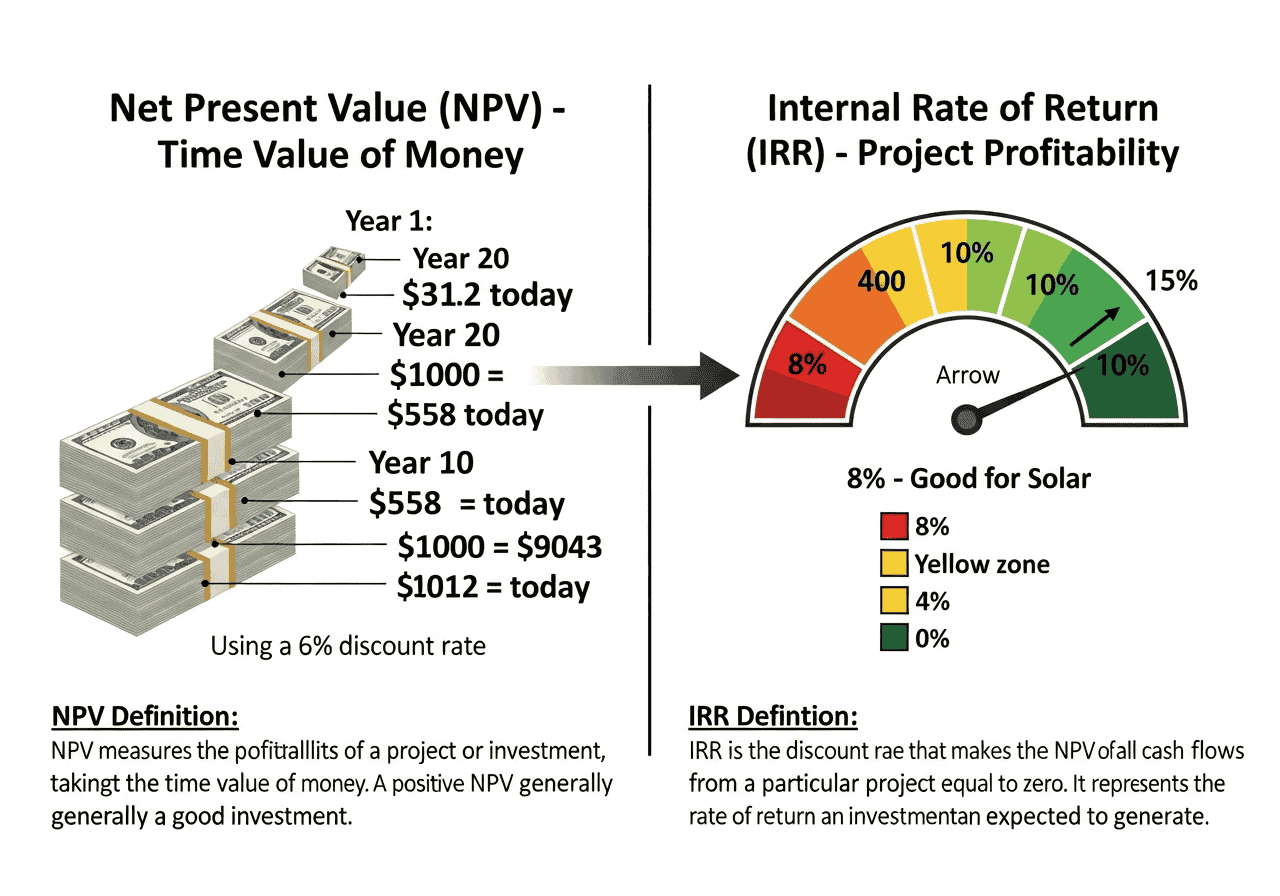
Net Present Value (NPV)
A positive NPV means your solar investment outperforms your chosen discount rate (opportunity cost of capital). Negative NPV means your money would perform better elsewhere.
Internal Rate of Return (IRR)
The IRR is the discount rate at which NPV equals zero — calculated using Newton-Raphson numerical iteration with bisection fallback for stability. Compare against alternative investment returns:
| IRR Range | Interpretation | Action |
|---|---|---|
| >12% | Outstanding | Proceed confidently |
| 8–12% | Excellent | Strong investment case |
| 5–8% | Competitive | Solid for most homeowners |
| 3–5% | Marginal | Consider incentives/rebates |
| <3% | Poor | Revisit assumptions or size |
Payback Period Guide
Step-by-Step: Using the Solar Calculator for Maximum Accuracy
- Select your region — choose from 23+ regional presets to auto-populate typical export/import tariffs and local currency. Always verify rates against your actual utility bill before making investment decisions.
- Enter system specifications — input system size (kW) and either cost-per-kW from installer quotes or total system cost including installation, permits, and battery minus tax credits.
- Add generation and consumption data — use your installer’s PVWatts estimate for monthly generation and 12 months of utility bills for average consumption. More accurate inputs = more accurate 25-year projections.
- Set financial assumptions — degradation (0.5% for Tier 1 panels), escalation (2.5% historical average), and discount rate (your opportunity cost of capital, typically 6–8%).
- Enable the 12-month seasonal profile (optional) — input relative monthly multipliers to reflect seasonal generation patterns rather than a flat annual average. The calculator normalizes them automatically.
- Click Calculate — instantly view monthly net credit, annual savings, payback year, 25-year NPV, IRR, energy balance charts, and the full year-by-year projection table.
- Save scenarios and compare — save multiple configurations (different sizes, batteries, locations) using the Scenario Manager and compare side-by-side.
- Download your PDF report — generate a professional 25-year financial report with charts and projection table to compare installer quotes objectively.
Understanding Your Solar Calculator Results
Monthly Net Credit — What It Means
A positive monthly net credit means your exported solar energy earns more than you pay for imported grid power that month. A negative credit means imports exceed export earnings — often desirable if it signals high self-consumption of low-cost solar electricity.
25-Year NPV Interpretation
| 25-Year NPV | Verdict | Recommended Action |
|---|---|---|
| Above $15,000 | Outstanding | Proceed immediately |
| $10,000–$15,000 | Strong | Excellent investment |
| $5,000–$10,000 | Solid | Good for most homeowners |
| $0–$5,000 | Marginal | Review assumptions and incentives |
| Negative | Poor | Do not invest without major changes |
Advanced Scenarios: Comparing Solar Investment Options
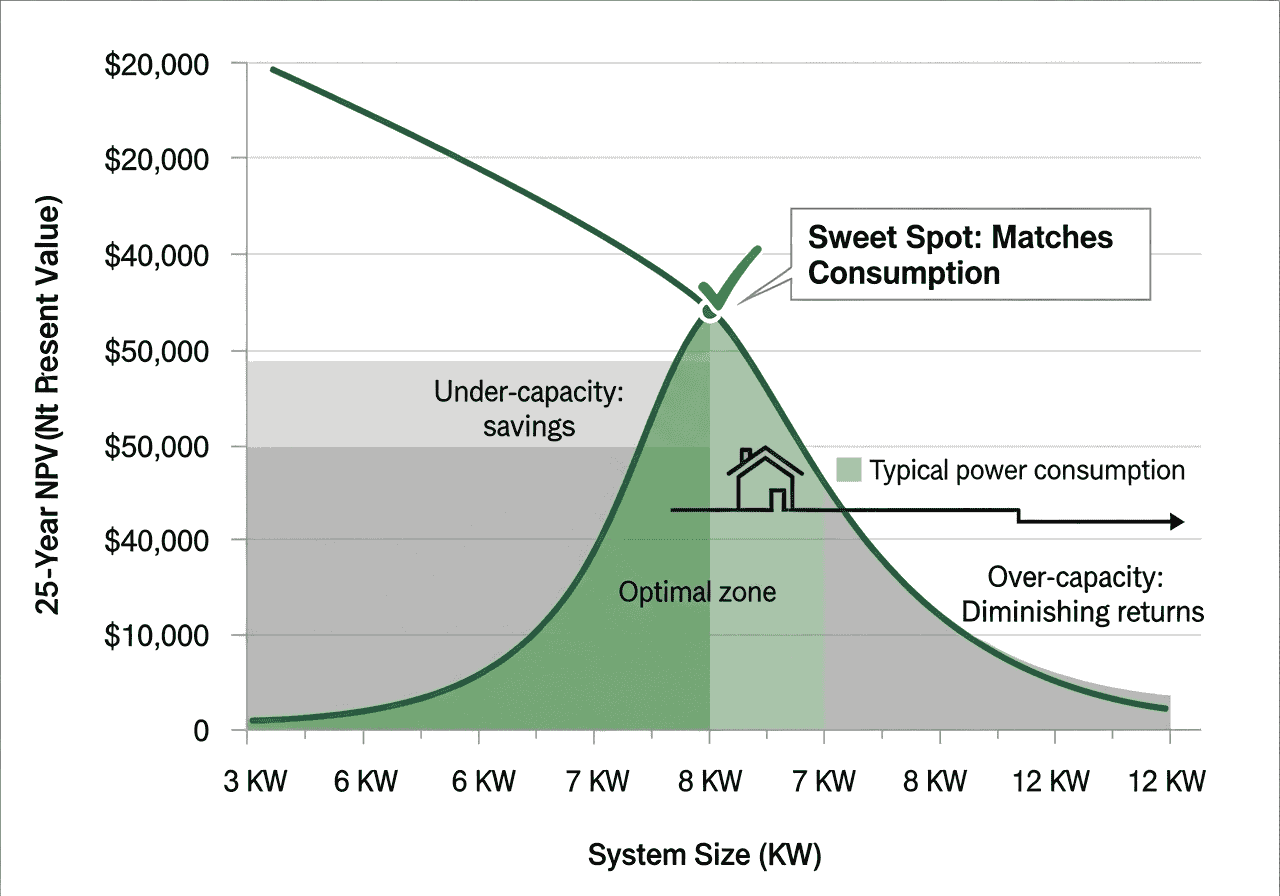
Scenario Comparison: System Size Optimization
The most common mistake in solar system sizing is designing for maximum generation rather than matching consumption. The solar net metering financial calculator makes this optimization straightforward:
Battery Storage: When Does It Improve ROI?
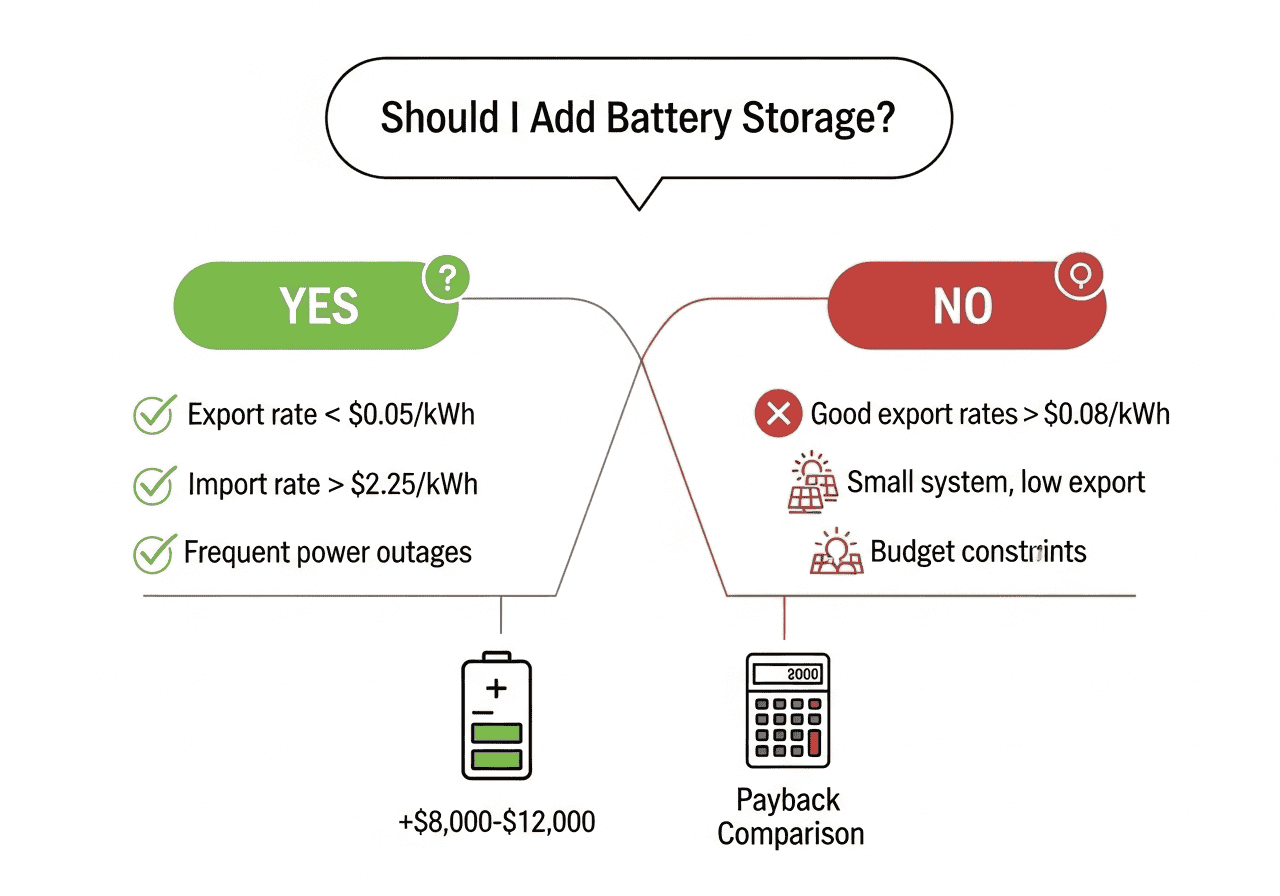
Battery storage adds $7,000–$15,000 to system cost but improves ROI in markets with:
- Time-of-use (TOU) pricing — store cheap midday solar, avoid expensive evening rates
- Very low export tariffs — below $0.05/kWh makes storing vs exporting financially attractive
- Frequent grid outages — energy security has real monetary value
- Virtual net metering programs — some utilities offer premium credits for battery-backed export
Model both scenarios in the calculator by adjusting monthly consumption (battery increases self-consumption) and system cost. The payback and NPV comparison tells the complete story.
7 Common Mistakes When Calculating Solar ROI
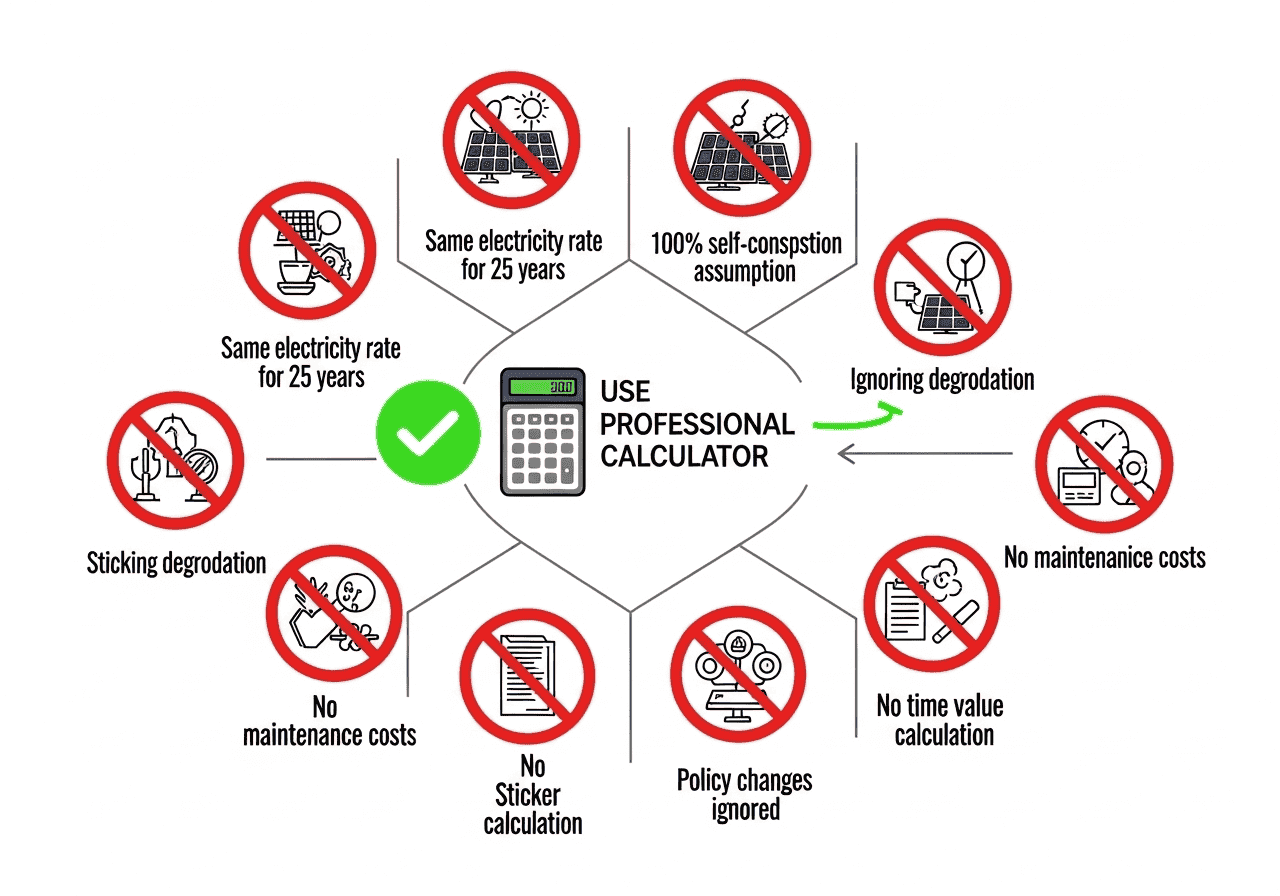
Omitting 0.5% annual degradation overestimates 25-year savings by 12–15%. Always model realistic degradation in your solar financial analysis.
Zero escalation undervalues solar by 30–50% over project lifetime. Historical rates increased 2.8%/yr in the US from 1990–2020.
Without time-value-of-money discounting, payback periods look artificially attractive. A dollar saved in 2045 is not worth a dollar today.
Most homes export 20–40% of generation. Assuming total self-consumption inflates savings estimates unless battery storage is included.
Two $10,000 systems with different efficiency, warranty, or degradation rates have vastly different 25-year NPVs. Total cost of ownership matters.
String inverters last 10–15 years ($1,000–$2,500 replacement around year 12). Microinverters last longer but cost more upfront. Budget accordingly.
California’s NEM 3.0 reduced export credits by 75% overnight. Model conservative export rates and consider policy change sensitivity scenarios.
Systems sized beyond consumption rely on low-value exports. Size to consumption first; oversizing typically reduces IRR in most global markets.
Real-World Case Studies: Solar Net Metering Calculator in Action
Frequently Asked Questions about Solar net metering Calculator
What is a Wall Plaster Quantity Calculator?
A Wall Plaster Quantity Calculator is a digital tool that estimates cement bags, sand volume, and total plaster material based on your wall area, plaster thickness, mix ratio, and wastage percentage. It applies engineering-standard formulas — including a dry volume factor of 1.35 and cement bulk density of 1440 kg/m³ — to give accurate material estimates in seconds.
How does the plaster quantity calculation work?
The calculator multiplies wall area by plaster thickness to get wet volume, then multiplies by 1.35 to account for dry volume expansion. It then splits the result by your chosen cement-to-sand ratio and converts cement volume to bags using standard bulk density. Finally, it applies your wastage factor to give final quantities for ordering.
Why should homeowners use a plaster calculator?
Using a plaster calculator prevents both over-ordering and under-ordering — the two most common causes of project delays and budget overruns. It removes the guesswork from mix ratios, unit conversions, and wastage estimation. Contractors using digital calculators reduce material waste by an average of 23%, saving hundreds to thousands of dollars per project.
When should I use a 1:4 versus 1:5 mix ratio?
Use a 1:4 mix for external walls, high-moisture areas, and commercial applications where strength is critical. Use a 1:5 mix for standard residential interior walls where economy and workability matter more. For ceilings and non-structural finishing, a 1:6 lean mix is sufficient and more cost-effective.
How much does plastering typically cost per square foot?
In the United States, professional plastering runs $3.50–$5.00 per square foot for labor alone. Add $0.40–$0.60 per square foot for materials (cement and sand). Total installed cost for a 500 ft² project typically ranges from $2,000 to $3,000 depending on wall condition, mix specification, and local labor rates.
Is a 1:5 vs 1:6 mix ratio better for interior walls?
For most residential interior walls, 1:5 is the better choice. It provides adequate strength for long-term durability while remaining easy to apply and cost-effective. A 1:6 mix is acceptable for low-stress areas like ceilings or utility rooms, but may produce a slightly weaker finish that is more susceptible to surface damage over time.
Is a wall plaster quantity calculator worth using for small projects?
Yes — even for a single room, a calculator saves time and prevents the common mistake of buying one too few bags. The calculation takes under two minutes, and accurately knowing your quantities lets you shop smarter, compare supplier prices, and avoid emergency mid-project runs to the hardware store.
How long does plaster take to fully cure?
Initial set occurs within 24–48 hours. Practical working strength develops in 7 days, at which point light painting preparation can begin. Full chemical cure takes 28 days. During the first 7–10 days, keep the surface damp by sprinkling water 2–3 times daily to prevent shrinkage cracking and ensure complete hydration.
References & Trusted Data Sources
The following authoritative sources were used to validate assumptions, solar resource data, financial models, and regulatory information used in this solar net metering financial calculator:
- ☀️ NLR PVWatts — US & global solar production estimates
- 🔬 NLR SAM — Detailed system simulation & financial modelling
- 🌍 PVGIS (European Commission) — Solar irradiance data
- 🌐 IRENA — Global renewable energy statistics & policy
- 📊 EIA — US electricity rate historical data
- 🏭 SEIA — US solar industry statistics & net metering policy
- ⚙️ PVsyst — Professional PV simulation & loss modelling
- 📚 Google Scholar — Peer-reviewed solar degradation & LCOE research
Make Data-Driven Solar Decisions in 2026 and Beyond
Solar panels represent one of the most accessible and impactful home investments available — but only when the numbers work in your favour. The difference between a 6-year payback and a 16-year payback often comes down to system sizing, self-consumption strategy, and accurate financial modelling.
2. Pull 12 months of utility bills for your actual average consumption.
3. Check your utility’s current net metering export and import tariff rates.
4. Run the Solar Net Metering Financial Calculator above with your real numbers.
5. Save multiple scenarios (with/without battery, different sizes).
6. Download the PDF report to compare quotes objectively.
Your future self — and your electricity bill — will thank you for doing the math first. Use the free Solar Net Metering Financial Calculator at the top of this page to run your personalized 25-year solar investment analysis now.