

Soil Texture Classifier Calculator
Enter sand, silt, and clay percentages. The calculator validates the 100% total, classifies texture, and plots the sample on a soil texture triangle.
Balanced mineral soil with moderate water holding capacity, aeration, and workability.
If lab values do not total 100 because of rounding, use Normalize to scale them proportionally.
Soil Texture Triangle Calculator: Complete USDA Classification Guide
Most farmers spend years fighting poor crop yields, waterlogging, or compaction — never realizing the problem is right beneath their feet. The soil texture triangle calculator above takes three numbers and tells you exactly what you’re working with. This guide explains how to read it, what the 12 USDA soil texture classes mean, and how to act on your result.
What Is a Soil Triangle?
A soil triangle — also called the soil texture triangle or textural triangle — is a ternary diagram that classifies soil based on three particle size percentages: sand, silt, and clay. Developed by the USDA Natural Resources Conservation Service and first standardized in 1938, it maps every possible soil composition to one of 12 named texture classes. Every valid point inside the triangle represents values that sum to 100%.
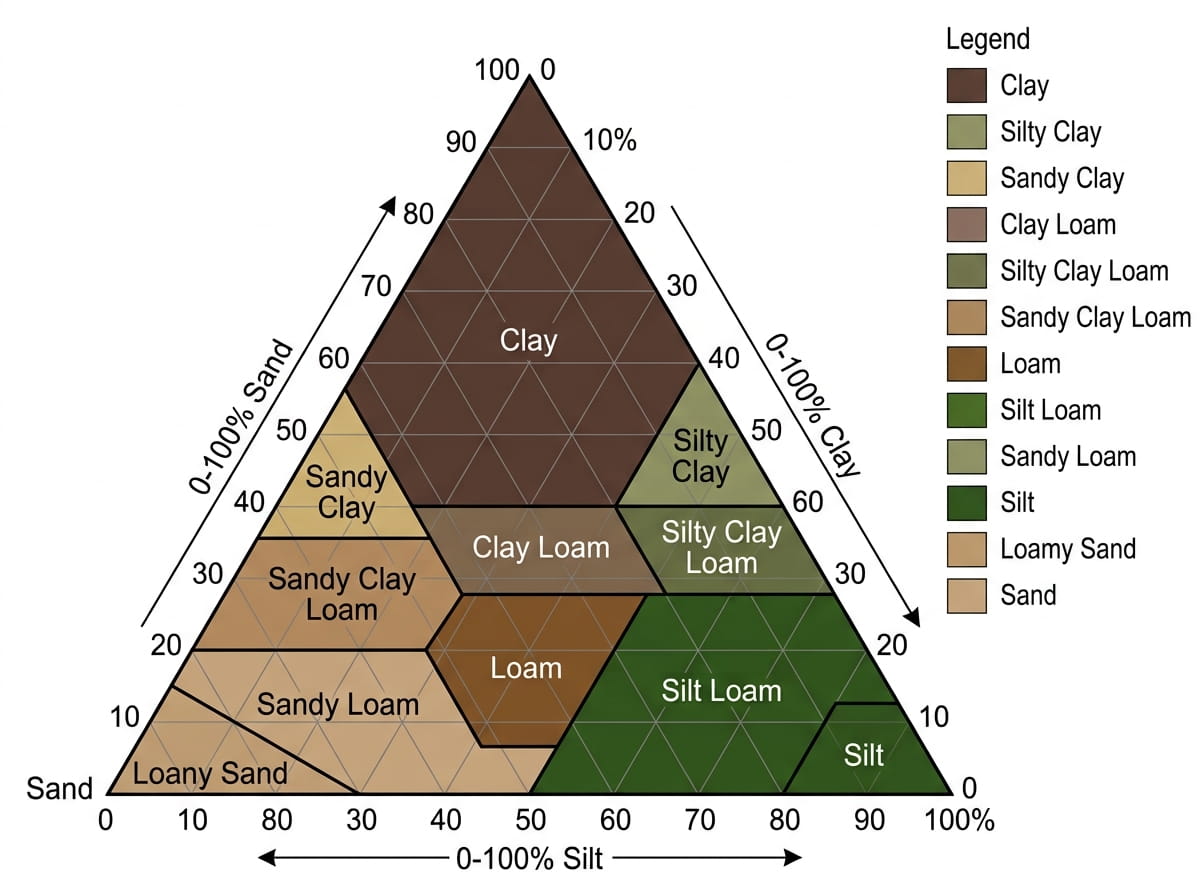
The official USDA Soil Texture Triangle with all 12 texture classes. Source: USDA–NRCS Soil Survey Manual, Handbook No. 18 (2017).
Think of it as a map with three axes instead of two. You know three numbers — sand, silt, clay — and the triangle tells you exactly which of the 12 standard soil types you’re holding. No guessing. One answer.
The system works because any three values that must total 100% can be plotted on a ternary (three-component) diagram. Fix two values and the third is automatically determined. That’s why the triangle captures every possible soil composition in one compact chart — the same mathematical principle engineers use for alloy composition diagrams and materials scientists use for phase diagrams.
The three axes explained
According to the USDA NRCS, soil texture is one of the five most critical soil properties affecting agricultural productivity. It determines water retention, nutrient availability, drainage behavior, and workability — all of which directly affect yield potential.
Related tools that work alongside texture data: our fertilizer and farming calculators use texture class as a key input for nutrient and irrigation planning.
How to Read a Soil Texture Triangle Chart
To read a soil texture triangle, find your clay percentage on the left axis and trace a line parallel to the base. Then find your sand percentage on the bottom and trace a line parallel to the right side. Where the two lines meet inside the triangle is your texture class. The calculator at the top of this page automates this entirely — enter your three percentages and click Classify.
Understanding the manual method helps you interpret borderline soils — those sitting close to the boundary between two texture classes. A soil right on the Loam–Clay Loam border behaves like both classes depending on moisture conditions. Knowing that tells you to read the management guidance for both.
Step-by-step: reading the triangle manually
Clay axis — left side
Clay % is shown on the left axis. Lines of equal clay run parallel to the bottom edge — horizontal. Find your clay value and trace that line across the triangle from left to right.
Sand axis — bottom
Sand % is on the bottom axis. Lines of equal sand run diagonally from lower-left to upper-right. Find your sand value and trace that line upward into the triangle.
Find the intersection
Where your clay line and sand line cross is your soil composition point. The labeled zone it falls in is your USDA texture class. Silt isn’t plotted separately — once sand and clay are fixed, silt is determined by subtraction.
Cross-check with silt axis
As verification, trace your silt line from the right axis inward. All three lines should converge at one point. If they don’t, one of your percentages is wrong.
Borderline soils: If your plotted point sits within one grid square of a class boundary, read the management notes for both adjacent classes. The soil will exhibit mixed characteristics — and which one dominates often depends on rainfall, season, and tillage history.
The 12 USDA Soil Texture Classes Explained
The USDA recognizes 12 soil texture classes defined in the Soil Survey Manual (Handbook No. 18, 2017): Sand, Loamy Sand, Sandy Loam, Loam, Silt Loam, Silt, Sandy Clay Loam, Clay Loam, Silty Clay Loam, Sandy Clay, Silty Clay, and Clay. Each class has specific sand, silt, and clay percentage boundaries. Loam — with roughly balanced fractions — is the most agriculturally productive class for most crops.
Sandy soils
Clay <10%, silt <15%, sand dominates. Drains in minutes. Warms fast in spring. Near-zero nutrient storage. Good for drought-tolerant natives and fast-draining specialty crops.
Sand 70–91%, clay <15%. Slightly better water retention than pure sand. Works well for root crops needing loose, friable soil. Needs regular organic matter inputs.
Clay <20% with sand ≥52%, or very low clay and silt <50%. Easy to work. Good drainage. Carrots, potatoes, and peanuts thrive here with consistent moisture management.
Loamy soils
Clay 7–27%, silt 28–50%, sand 23–52%. The benchmark soil. Balanced drainage, water retention, and fertility. Supports the widest crop range. If you have it, protect it.
Clay 20–35%, sand ≥45%. Drains faster than pure clay loam. Good for cotton and sorghum. Watch for surface crusting after heavy rain — the clay fraction can seal pores.
Clay 27–40%, silt <40%, sand 20–45%. Holds moisture well. More workable than clay. Most row crops tolerate it. Avoid tillage when wet.
Silty soils
Silt ≥50% with clay <27%. Highly fertile floodplain soil. Excellent water retention. Compacts badly under wet machinery — plan field operations carefully.
Silt ≥80%, clay <12%. Very fine texture. Great water and nutrient holding but structurally fragile. Erodes easily under rain or wind. Rare as a dominant topsoil class.
Clay 27–40%, silt ≥40%. Rich in nutrients. Prone to compaction when wet. Organic matter additions are essential to maintain aeration and workability.
Clayey soils
Clay ≥35%, sand ≥45%. Drains faster than pure clay but still sticky. Heavy when wet, hard when dry. Common in certain alluvial deposits.
Clay ≥40%, silt ≥40%. Very sticky when wet, hard and cracked when dry. High nutrient capacity. Needs gypsum and careful management to be productive.
Clay ≥40% (and not Sandy Clay or Silty Clay). Shrinks and cracks when dry, swells and smears when wet. High CEC and fertility if managed well. Rice paddies love it.
| Texture Class | Clay % | Silt % | Sand % | Key Constraint |
|---|---|---|---|---|
| Sand | <10 | <15 | ≥85 | silt + (1.5 × clay) ≤ 15 |
| Loamy Sand | <15 | — | 70–91 | silt + (2 × clay) < 30 |
| Sandy Loam | <20 | <50 | ≥52 (or clay <7, silt <50) | Multiple qualifying combinations |
| Loam ⭐ | 7–27 | 28–50 | 23–52 | Best all-round agricultural soil |
| Silt Loam | <27 | ≥50 | — | Or silt ≥80% and clay <12% |
| Silt | <12 | ≥80 | — | Rare as topsoil class |
| Sandy Clay Loam | 20–35 | <28 | ≥45 | — |
| Clay Loam | 27–40 | <40 | 20–45 | Silt constraint separates from Silty Clay Loam |
| Silty Clay Loam | 27–40 | ≥40 | <20 | — |
| Sandy Clay | ≥35 | — | ≥45 | High sand + high clay combination |
| Silty Clay | ≥40 | ≥40 | — | — |
| Clay | ≥40 | — | — | Excludes Sandy Clay and Silty Clay zones |
Note: These boundaries follow the official USDA decision-tree classification as documented in the USDA Soil Survey Manual (Handbook No. 18). The “—” symbol means that fraction has no fixed upper or lower limit for that class beyond what is implied by the other two fractions summing to 100%.
How to Use the Soil Texture Test Online — Step by Step
Enter your sand, silt, and clay percentages into the three fields in the calculator at the top of this page. Confirm the total equals 100%. Click “Classify.” The tool instantly plots your soil on the interactive USDA triangle, returns your texture class, and shows management guidance. Use “Download CSV” to save results or “Print Report” for documentation.
Getting your soil percentages first
| Method | Accuracy | Cost | Time | Best For |
|---|---|---|---|---|
| Lab hydrometer (ASTM D422) | ±2% | $25–$75/sample | 1–2 weeks | Precision crop and engineering decisions |
| Laser diffraction (lab) | ±1% | $50–$150 | 1–3 days | Research and precision agriculture |
| Jar sedimentation test | ±10% | Free | 24–48 hours | DIY screening, garden planning |
| Ribbon / feel test (field) | ±15–20% | Free | 5 minutes | Quick field estimates, borderline confirmation |
Using the calculator
Enter sand percentage
Type your sand value (0–100) into “% Sand.” Use your lab report number directly. Decimal values are accepted.
Enter silt and clay
Fill in “% Silt” and “% Clay.” The calculator shows a running total — watch for the 100% confirmation before classifying.
Click Classify
Press the green Classify button. A dot appears on the triangle at your exact position, and the texture class populates with management notes below.
Export your results
Download CSV for GIS or farm records. Print Report generates a formatted document for extension consultations or project files.
FAO vs USDA naming: Switch the dropdown to “FAO / International” if you’re comparing with reports from outside the US. Class boundaries stay the same — only the names shift slightly (e.g., USDA “Sandy Loam” maps to FAO “Light Loam”).
Video: How to read a soil texture triangle
This short tutorial walks through reading the USDA textural triangle manually and interpreting your soil texture class result.
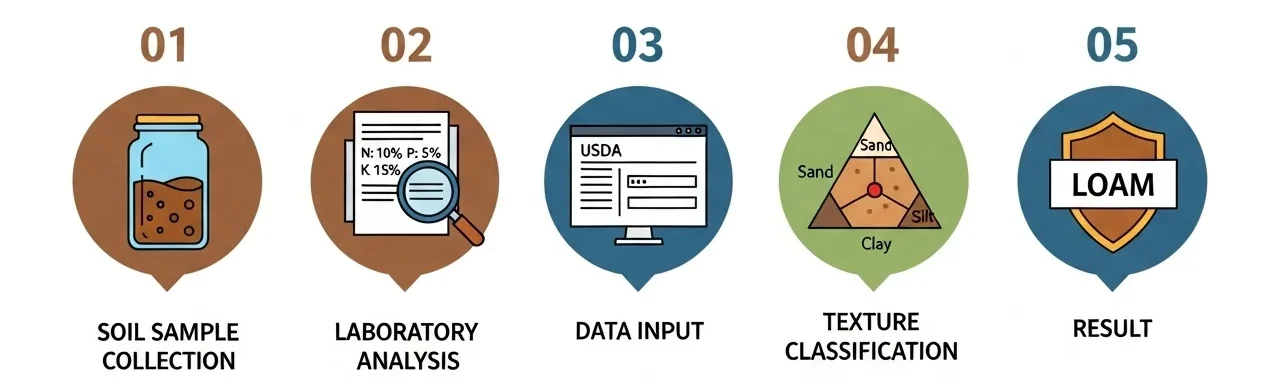
The five-step workflow: collect sample → get percentages → enter into calculator → read triangle position → apply management recommendations.
Soil Texture Classification Chart: Key Data Patterns
The USDA soil texture classification chart maps every sand/silt/clay combination to one of 12 labeled zones. Clay dominates the upper third; sand fills the lower left; silt occupies the lower right; Loam sits near the center. The chart was first standardized by the USDA in 1938 and is the primary soil classification reference for agriculture, engineering, and environmental science globally.
Three things stand out when you study the USDA soil classification chart carefully.
Clay is the dominant classifier. The top third of the triangle is almost entirely clay-named classes. Even modest increases in clay — from 35% to 45% — dramatically change soil behavior because clay particles are plate-shaped and carry electrical charges. They bind water and nutrients in ways sand and silt physically cannot.
Loam occupies a surprisingly small zone. It’s the most sought-after soil for agriculture, but the precise sand/silt/clay combination required doesn’t occur naturally as often as people expect. That’s partly why quality loam commands premium prices for landscaping and horticulture.
Silt gets its own class only at extreme concentrations — more than 80% silt content. That level is rare except in certain floodplain deposits and glacial lacustrine soils.
| Soil Texture | Available Water (in/ft) | Irrigation Interval (shallow crop) | Drainage Speed |
|---|---|---|---|
| Sand | 0.5–0.8 | 1–2 days | Very fast |
| Loamy Sand | 0.8–1.0 | 2–3 days | Fast |
| Sandy Loam | 1.0–1.4 | 3–5 days | Moderate-fast |
| Loam ⭐ | 1.4–2.0 | 5–8 days | Moderate |
| Silt Loam | 1.8–2.2 | 7–10 days | Moderate-slow |
| Clay Loam | 1.6–2.0 | 8–12 days | Slow |
| Silty Clay Loam | 1.4–1.8 | 9–13 days | Slow |
| Clay | 1.2–1.6 | 10–14 days | Very slow |
These AWC figures come from USDA-NRCS Soil Survey literature and represent class medians. A farmer with sandy loam may need to irrigate twice as often as one with silt loam — same crop, same weather, completely different water management. Get this wrong and no amount of fertilizer compensates.
For irrigation scheduling based on your soil type, use the Solvebility farming calculators alongside this texture result.
Common Soil Texture Examples
A 40/40/20 sand/silt/clay mix classifies as Loam. An 80/10/10 mix is Loamy Sand. A 20/35/45 mix is Clay. A 15/65/20 mix is Silt Loam. Enter any combination into the free soil type calculator above to see exactly where it falls on the USDA triangle and get specific management guidance for your result.
The textbook loam. Balanced. Good for vegetables, row crops, lawns. Most growers would love this result.
Mostly sand. Drains immediately. Common near coastlines and old river deposits. Add compost every season or nutrients vanish with irrigation water.
Dominated by clay. Dense, heavy, sticks to boots when wet. High fertility but difficult drainage. Rice and native wetland plants do well. Most vegetables need raised beds.
Classic floodplain soil. Extremely fertile. Compacts badly under foot traffic or equipment when wet — plan field operations carefully.
Good for cotton and sorghum. Drains faster than clay loam. Surface can crust after heavy rain — the clay fraction seals pores when wet and dries into a cap.
According to the USDA Web Soil Survey, loam and silt loam are the most common texture classes across US agricultural land — together covering roughly 35% of cropland soils. If you haven’t tested your soil yet, there’s a reasonable chance you’re in one of these two classes.
Real Case Study: How Soil Texture Testing Led to a 22% Yield Increase
A corn farmer in central Iowa spent three consecutive seasons applying heavy nitrogen fertilizer on a field producing below-average yields. A soil texture test revealed the problem wasn’t nutrient deficiency — the field had two distinct texture zones, with sandy loam in the east half and clay loam in the west. Variable irrigation and fertilizer rates matched to each zone increased corn yield by 22% without increasing total input costs.
The problem: uniform management on non-uniform soil
A 180-acre corn operation had been applying identical irrigation schedules and fertilizer rates across the entire field for 4 years. East half consistently yielded 15–18% below the west half with no obvious explanation. Nutrient tests showed adequate NPK across both zones.
After a grid-based soil texture assessment (9 sampling points per 40 acres), the USDA triangle calculator returned two distinct classifications:
- East half: Sandy Loam (65% sand, 18% silt, 17% clay)
- West half: Clay Loam (28% sand, 30% silt, 42% clay)
The sandy loam zone was draining irrigation water — and nitrogen — well below the root zone before plants could use it. The clay loam zone was retaining too much water, causing periodic oxygen stress. Both zones were managed identically. Neither was performing well.
The fix: texture-matched management zones
Sandy Loam zone: irrigation frequency increased by 40%, nitrogen split into 4 applications instead of 2. Clay Loam zone: irrigation volume reduced by 25%, drainage tile added at 30-foot spacing.
Key insight: The $180 soil texture analysis cost was recovered in the first season from reduced nitrogen waste alone. The yield increase was a bonus.
This is why agronomists consistently recommend soil texture testing before adjusting any other input. Texture determines how every other input — water, fertilizer, amendments — behaves in that soil. Fix the management to match the texture, and inputs start working as intended.
Global Soil Classification Systems: USDA vs FAO vs UK-ADAS
Three major soil texture classification systems are used worldwide: the USDA system (12 classes, most common in North America), the FAO/WRB system (adapted from USDA with slightly different class boundaries, used internationally), and the UK-ADAS system (11 classes, used across the UK and parts of Europe). All three use sand, silt, and clay percentages as inputs — but their boundary definitions differ, so the same soil sample can classify differently depending on which system you use.
| Feature | USDA (USA) | FAO / WRB (International) | UK-ADAS (UK / Europe) |
|---|---|---|---|
| Number of classes | 12 | 12 (adapted) | 11 |
| Silt particle size | 0.002–0.05 mm | 0.002–0.063 mm | 0.002–0.063 mm |
| Primary authority | USDA NRCS | FAO / UN | ADAS UK |
| Used in | USA, Canada, many others | Global soil surveys | UK, Ireland, parts of EU |
| Calculator default | ✓ Default | Available (FAO dropdown) | Not included |
| USDA “Loam” equivalent | Loam | Medium Loam | Sandy Silt Loam / Silt Loam |
| USDA “Clay” equivalent | Clay | Heavy Clay | Clay |
| USDA “Sandy Loam” equiv. | Sandy Loam | Light Loam | Sandy Loam |
Why the silt boundary matters
The key difference between USDA and FAO/WRB systems is the silt particle size limit. USDA defines silt as 0.002–0.05 mm. FAO and WRB use 0.002–0.063 mm — a wider range that includes some very fine sand particles. This means soils with 10–15% of particles in the 0.05–0.063 mm range will classify differently depending on which system your lab uses.
If you receive a soil report from an international source (Australia, UK, most of Europe), check which silt definition was used before entering values into a USDA-based calculator. Our tool uses the USDA definition and the FAO naming dropdown provides terminological equivalents — not boundary corrections.
The FAO Soils Portal documents the World Reference Base (WRB) classification methodology, which is the international standard used in global soil surveys and environmental assessments outside North America.
For related soil and land tools, see the Solvebility civil engineering calculators — several use soil classification inputs for foundation and drainage design work.
Applications of Soil Texture Analysis
Soil texture analysis informs decisions in agriculture, irrigation design, landscaping, environmental engineering, and soil science research. The USDA textural triangle is the shared reference across all these fields because it provides a standardized, repeatable classification from three simple measurements.
Agriculture and crop selection
Matching crops to soil texture is one of the oldest and most reliable practices in farming. Potatoes need loose sandy loam so tubers expand without resistance. Rice needs heavy clay that holds standing water. Corn and soybeans perform best on loam to silt loam. Get the texture wrong and no amount of fertilizer compensates.
| Crop | Optimal Texture | Tolerated Range | Key Reason |
|---|---|---|---|
| Corn / Maize | Loam, Silt Loam | Sandy Loam to Clay Loam | Balanced water retention |
| Soybeans | Loam, Clay Loam | Sandy Loam to Silty Clay Loam | Deep roots, drought tolerance |
| Potatoes | Sandy Loam | Loamy Sand to Loam | Easy tuber expansion |
| Carrots | Sandy Loam | Loamy Sand to Loam | Straight root development |
| Rice | Clay, Silty Clay | Clay Loam to Clay | Water retention for paddies |
| Cotton | Sandy Clay Loam | Sandy Loam to Clay Loam | Moderate drainage and depth |
| Alfalfa | Loam, Clay Loam | Sandy Loam to Silty Clay Loam | Deep root penetration |
| Wheat | Clay Loam, Silt Loam | Loam to Clay | Good moisture retention |
Irrigation planning
Sandy soils need drip irrigation or frequent sprinkler cycles. Clay soils need slow, deep watering with long intervals to avoid waterlogging. Loamy soils are flexible. Designing an irrigation system without knowing soil texture is guesswork — the texture determines infiltration rate, lateral water spread, and how long the root zone stays moist.
Environmental engineering
Soil texture determines how quickly contaminants travel from a spill site to groundwater. Sandy soils carry pollutants fast; clay slows them down while binding some compounds. Environmental impact assessments, landfill liner design, and bioswale sizing all start with texture classification.
Common Mistakes When Using the Soil Texture Triangle Calculator
The five most common mistakes are: values not totaling 100% (the calculator flags this), including organic matter or gravel in the percentages, sampling only one location in a field, testing topsoil while ignoring subsoil, and confusing soil texture (permanent) with soil structure (manageable). Fix the first three before entering any numbers.
Mistake 1: Values don’t add up to 100%
The calculator warns you automatically. But the warning is a symptom. Check whether your lab report includes organic matter as a separate fraction — many do. The USDA texture triangle classifies the mineral fraction only. Leave organic matter out.
Mistake 2: Including gravel
The USDA system only covers particles smaller than 2mm. Gravel and stones are “coarse fragments” and reported separately. If you ran a jar sedimentation test, remove all gravel before filling the jar.
Mistake 3: Single-sample testing
One sample from your field corner tells you almost nothing about the whole field. Take 5–10 samples per acre, mix them, analyze the composite. According to the Soil Science Society of America, texture can shift by two or more USDA classes within a few meters in variable landscapes.
Watch for this: If your field shows inconsistent crop performance across zones, the cause often traces to hidden texture differences — not nutrient issues. Zone-based texture testing is the correct diagnostic, not blanket fertilizer increases.
Mistake 4: Ignoring subsoil
Topsoil texture matters for germination and surface drainage. Subsoil texture (6–24 inches deep) controls drainage and root depth. A loam topsoil over clay subsoil drains poorly regardless of what the surface sample shows. Test both layers for any serious agricultural or construction application.
Mistake 5: Confusing texture and structure
Texture is fixed — you can’t cost-effectively change particle sizes. Structure (how particles clump into aggregates) is manageable with organic matter, cover crops, and careful tillage. Many farmers try adding sand to clay to “fix” it. It rarely works, often makes things worse, and costs a lot. Work on structure instead.
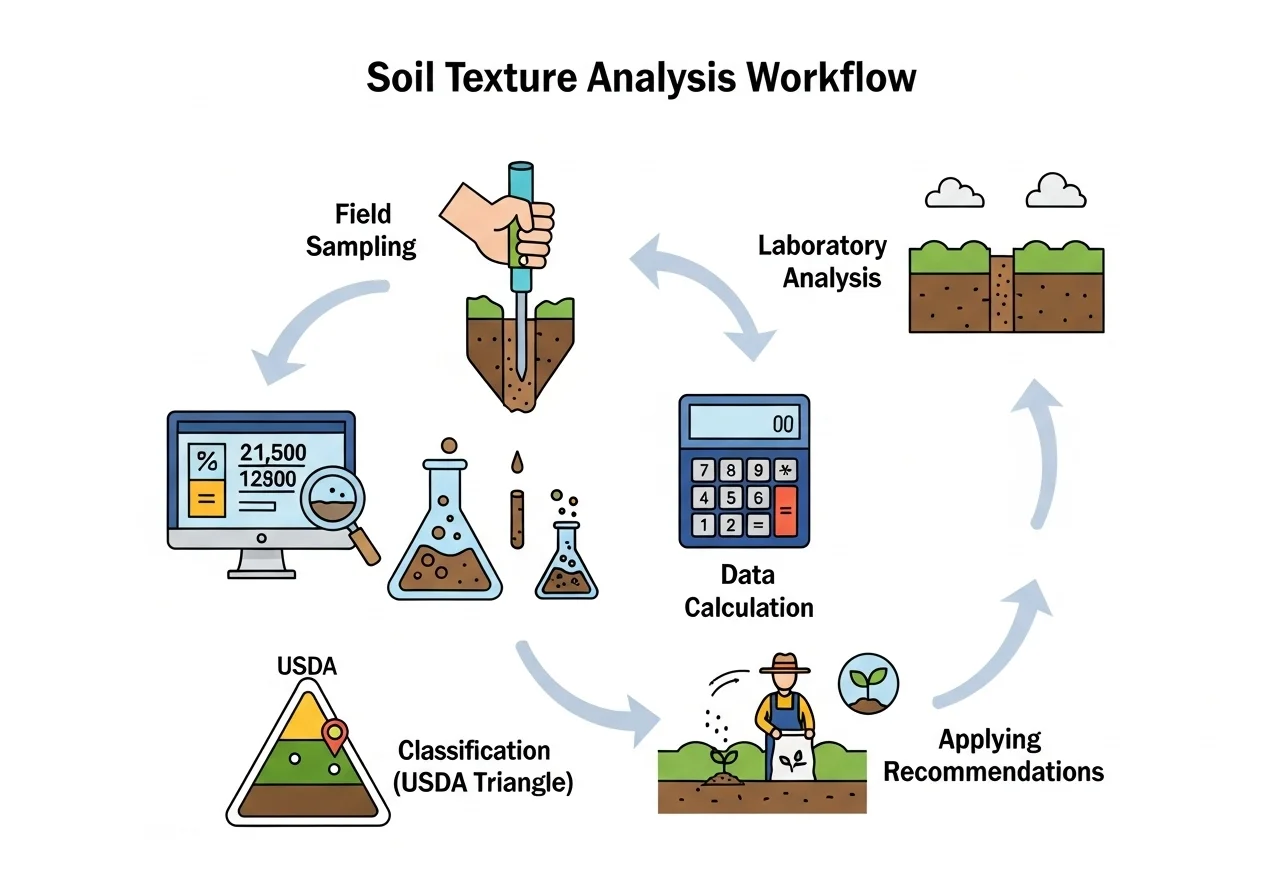
Complete workflow: field sampling → lab analysis → USDA triangle calculator → texture-matched management decisions.
Frequently Asked Questions
A soil triangle is a triangular ternary diagram used to classify soil based on the percentage of sand, silt, and clay it contains. Developed by the USDA and first standardized in 1938, it divides all soil compositions into 12 named texture classes. The USDA NRCS published the current boundaries in the Soil Survey Manual (Handbook No. 18, 2017). Every valid point inside the triangle represents values that sum to 100%.
Yes — our free soil texture test online calculator at the top of this page classifies your soil in under a minute. Enter your sand, silt, and clay percentages from a lab report, jar sedimentation test, or feel test. The tool returns your USDA texture class instantly with an interactive triangle visualization and management recommendations. No registration required, no cost, results downloadable as CSV.
Three ways to find your soil type: (1) Use the USDA Web Soil Survey at websoilsurvey.nrcs.usda.gov — enter your location and it returns mapped soil data for your area free. (2) Send a sample to a lab for hydrometer analysis ($25–$75), then enter the results into the soil type calculator free tool above. (3) Do a jar sedimentation test at home — fill a jar with soil and water, shake, let settle 24 hours, measure the distinct sand/silt/clay layers, and calculate percentages.
The 12 USDA soil texture classes are: Sand, Loamy Sand, Sandy Loam, Loam, Silt Loam, Silt, Sandy Clay Loam, Clay Loam, Silty Clay Loam, Sandy Clay, Silty Clay, and Clay. These are defined in the USDA Soil Survey Manual (Handbook No. 18, 2017) with specific sand, silt, and clay percentage boundaries. Loam is generally the most agriculturally productive class, balancing drainage, water retention, and fertility.
A soil texture calculator is fully accurate when given correct lab-measured percentages. The USDA classification algorithm is deterministic — same inputs always return the same result. Overall accuracy equals your input accuracy: lab hydrometer analysis (±2%) gives reliable classification; the jar test (±10%) can push borderline soils into an adjacent class; the feel test (±15–20%) is good for rough screening only. For critical decisions, use lab data.
The official USDA soil triangle chart printable PDF is available free from the USDA NRCS website at nrcs.usda.gov. It shows all 12 texture class boundaries with percentage grid lines for manual plotting. For most practical purposes, the interactive calculator above is faster and more accurate — just enter your percentages and the tool plots the point automatically without any manual reading of axes.
Soil texture refers to the permanent size of individual mineral particles (sand, silt, clay) and cannot be cost-effectively changed. Soil structure refers to how those particles clump into aggregates — this can be improved with organic matter, cover crops, and careful tillage. Most soil improvement programs target structure, not texture. Trying to change texture by adding sand to clay soil rarely works and is very expensive.
Loam is generally the best soil type for agriculture. It balances drainage, water retention, and nutrient availability, supporting the widest range of crops. Sandy loam is excellent for root vegetables. Silt loam works well for grain crops. Clay is preferred for rice paddies. The best choice depends on the specific crop — matching texture to crop requirements consistently outperforms blanket soil amendment attempts.
Putting It Together
The soil texture triangle has been the standard classification tool for over 80 years — because it works. Three numbers in, one texture class out. From there, every management decision gets clearer: which crops to grow, how to irrigate, what amendments actually help, and what problems to anticipate before they cost you a season.
You now know how to read the soil texture triangle calculator result, what all 12 USDA classes mean in practice, how to avoid the five most common mistakes, and how texture-matched management produced a 22% yield increase on an Iowa corn farm. The biggest mistake from here is skipping the soil test. Guessing texture from how soil looks or feels is right maybe 60% of the time. Lab numbers plus this calculator get you to 98%.
Test your soil. Classify it. Then manage it for what it actually is.
Classify Your Soil Now — Free
Enter your sand, silt, and clay percentages into the calculator at the top of this page. Instant USDA classification with interactive triangle, management recommendations, and CSV download.
Use the Calculator →Sources & Further Reading
Last Updated: | Next Review:
- USDA–NRCS Soil Science Division Staff. “Soil Survey Manual, Handbook No. 18.” 2017.
- USDA Natural Resources Conservation Service. “Soil Texture Calculator.” 2024.
- USDA NRCS. “Web Soil Survey.” 2024.
- Soil Science Society of America. “Glossary of Soil Science Terms.” 2024.
- Food and Agriculture Organization. “FAO Soils Portal & World Reference Base.” 2024.
- Colorado State University Extension. “Estimating Soil Texture.” 2026.