

Solar Time-of-Use Optimization Calculator: Save Up to 70%
Your solar panels make the most power at noon. Your bill spikes at 6 PM. That gap is where most of your savings leak out, and it’s exactly what a solar time-of-use optimization calculator is built to fix.
If you’ve got solar and your bill barely moved, you’re not doing anything wrong. Utilities charge three or four different rates depending on the hour, and your panels don’t know the difference between a cheap hour and an expensive one. Left alone, your system sells cheap power at noon and buys expensive power at 7 PM.
This guide walks through what a TOU optimization calculator actually does, how the dispatch math works, and how to use Solvebility’s free Solar Time-of-Use (TOU) Optimization Planner to find your own numbers. We built this using real utility rate schedules from SCE, SDGE, PG&E, Austin Energy, and PSEG, so the math reflects what’s actually on your bill, not a generic estimate. Depending on your tariff, load profile, and battery size, savings can range widely, and the calculator is the fastest way to find out where you land.
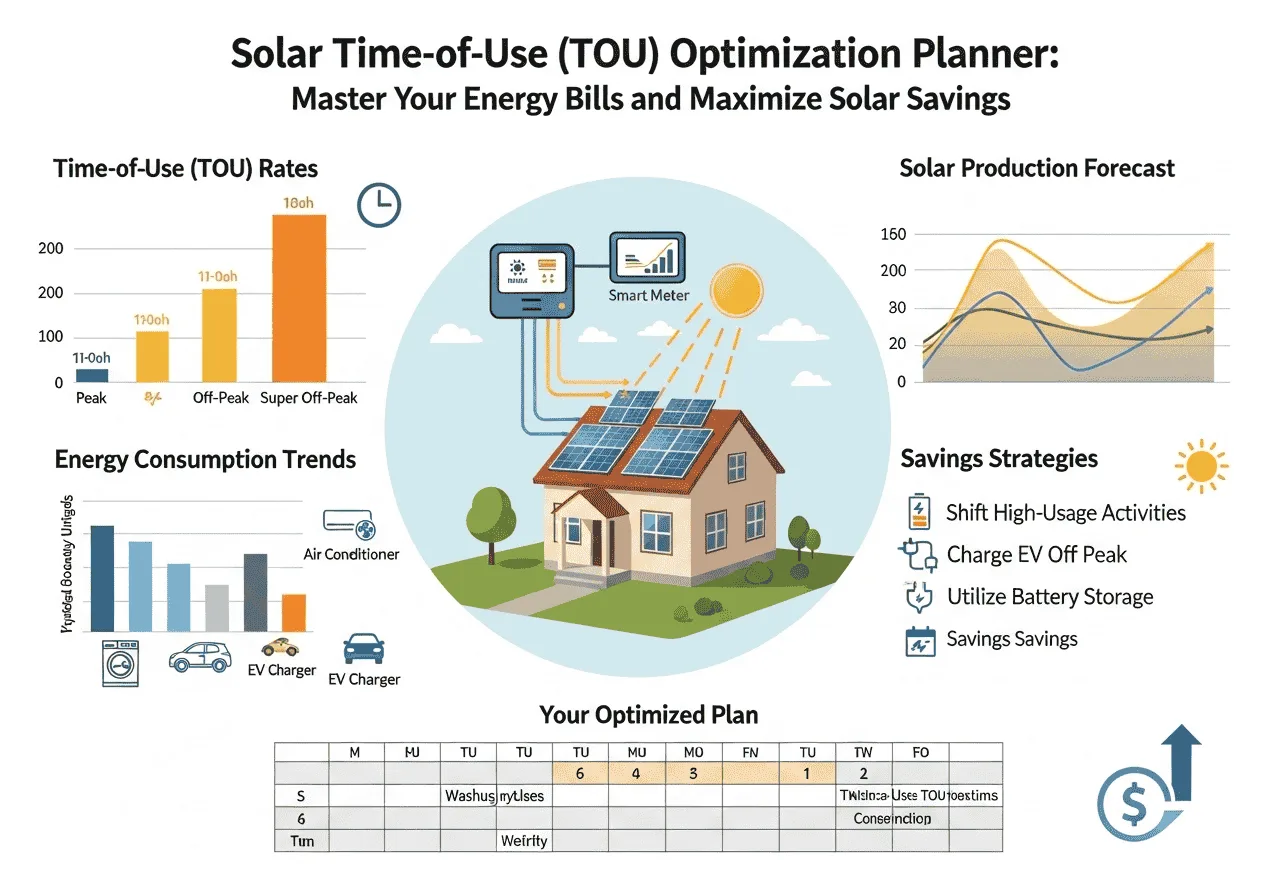
What Is a Solar Time-of-Use Optimization Calculator?
A solar time-of-use optimization calculator models your hourly electricity use, solar output, and battery specs against your utility’s peak, shoulder, and off-peak rates, then builds a dispatch plan that shifts your battery’s stored energy into the most expensive hours. It answers one question: when should your battery charge and discharge to save you the most money?
Most solar calculators stop at “how many panels do I need.” A TOU optimization calculator goes further. It treats your battery like a scheduling problem, not just a backup box, and figures out exactly which hours to charge, hold, or discharge based on what electricity costs at that moment.
The output is practical, not theoretical. You get an hourly breakdown of grid imports, grid exports, battery state of charge, and a total dollar figure, before and after optimization, so you can see exactly where the savings come from.
Why Your Solar Bill Is Still High During Peak Hours
Sarah installed a 10kW system in California and expected her bill to nearly disappear. It dropped 30%. Not nothing, but nowhere near what she’d been promised.
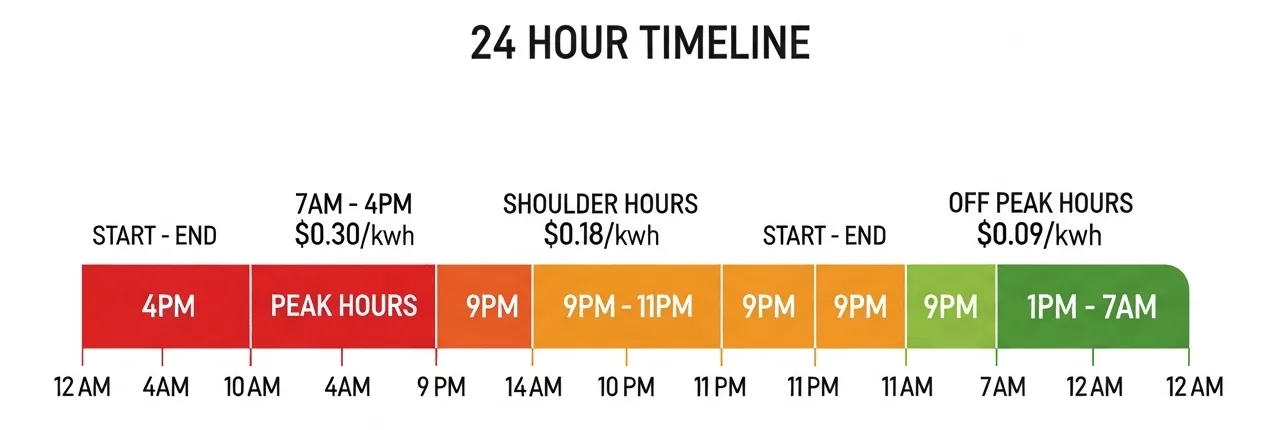
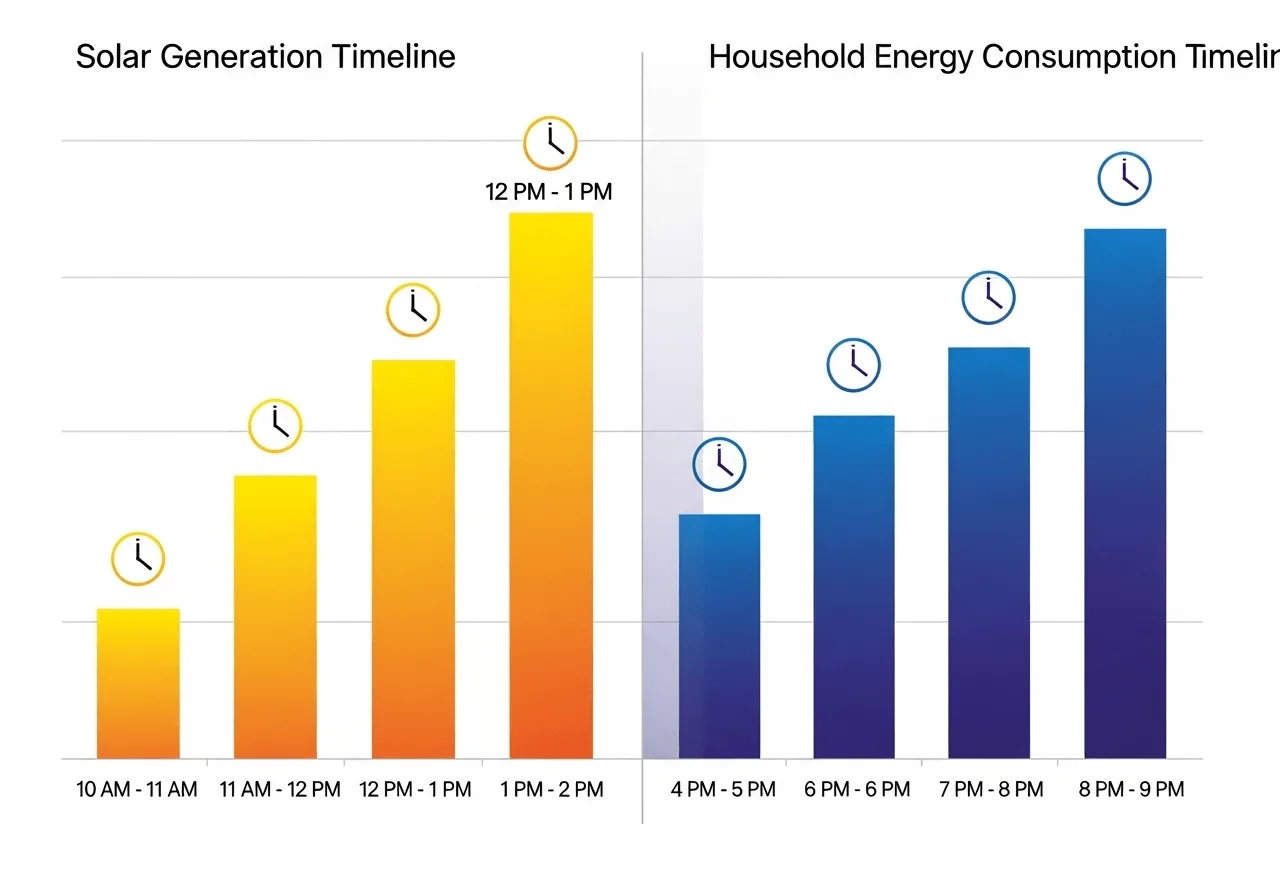
Here’s what happened. Her panels peaked at noon. Her family’s usage peaked between 6 and 9 PM, cooking dinner, running the AC, charging the car, right when SCE charges up to $0.74 per kWh. She was exporting cheap noon power and buying back expensive evening power. That’s the solar-demand mismatch, and it’s the single biggest reason solar-only homes underperform.
Two things go wrong at once when nobody’s watching the clock:
- Excess solar at noon sells back to the grid at low or no export credit
- Evening demand pulls expensive grid power at exactly the wrong hour
A battery closes that gap. But only if it’s told when to charge and when to hold its charge for the 6 PM price spike instead of dumping power the moment the sun goes behind a cloud.
How Does the TOU Optimization Algorithm Work?
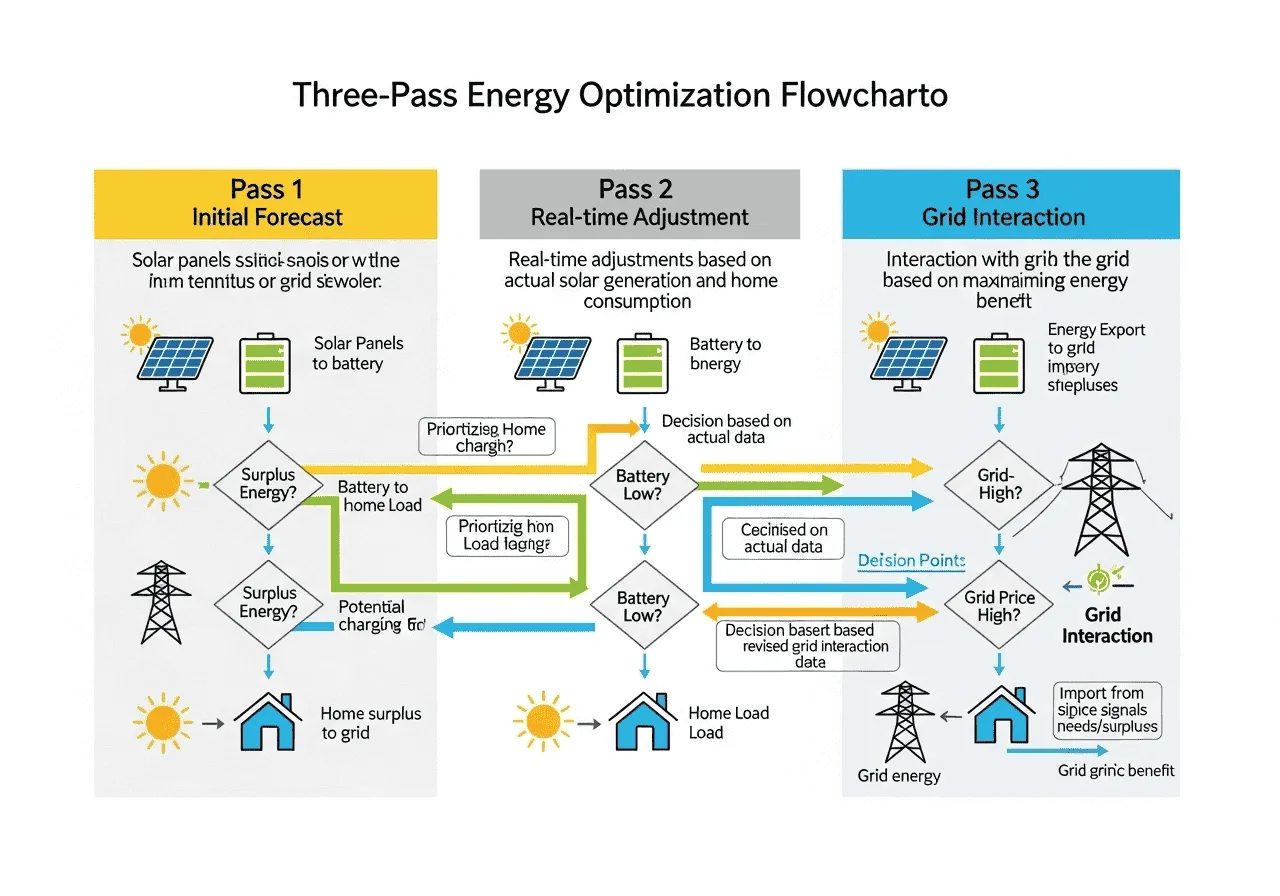
The planner runs a three-pass dispatch model: it matches solar directly to your load first, charges the battery with any leftover solar, then discharges the battery during your most expensive hours before pulling any power from the grid. Each pass narrows the gap between what you’d pay without a plan and what you actually pay with one.
Pass 1: Solar Utilization
Every kWh of solar goes straight to your household load first. Whatever’s left over charges the battery. Anything still left over gets exported.
Pass 2: Strategic Battery Discharge
The planner identifies your priciest hours, usually the evening peak window, and holds battery capacity back specifically for those hours instead of draining it the moment a cloud passes overhead.
Pass 3: Grid Import Minimization
Whatever demand is left after solar and battery gets bought from the grid, at the cheapest hours possible given what’s left in the tank.
Round-trip battery efficiency (usually 85-95% for lithium) eats into every kWh you store. A 10% loss on a 10kWh battery means you effectively get 9kWh back. Factor that into your sizing, not just the sticker capacity.
How to Use the Solar Time-of-Use Optimization Calculator
The tool sits at the top of this page. Here’s how to fill it in with numbers that actually mean something.
Step 1: Household Load Profile
Enter 24 hourly consumption values. Check your utility’s smart meter app for your actual pattern. No data yet? A medium home typically runs 0.3-0.6 kWh overnight, 0.8-1.8 kWh through the day, and 2.0-4.5 kWh during the 6 PM to midnight peak.
Step 2: Solar Generation Profile
Enter your hourly PV output. Your installer can provide this, or pull it from PVWatts®, developed by the National Renewable Energy Laboratory (NREL), a free solar production estimator. System size, orientation, shading, and season all move this number.
Step 3: Battery System Specs
Capacity in kWh, power rating in kW, and round-trip efficiency. Not sure what you’ve got? Check the table below for common models.
Step 4: Your TOU Tariff
Peak, shoulder, and off-peak rates in dollars per kWh, plus the hours each period runs. Your utility bill or rate sheet has these. Get this part right, it’s the whole engine.
Step 5: Optimize and Read the Results
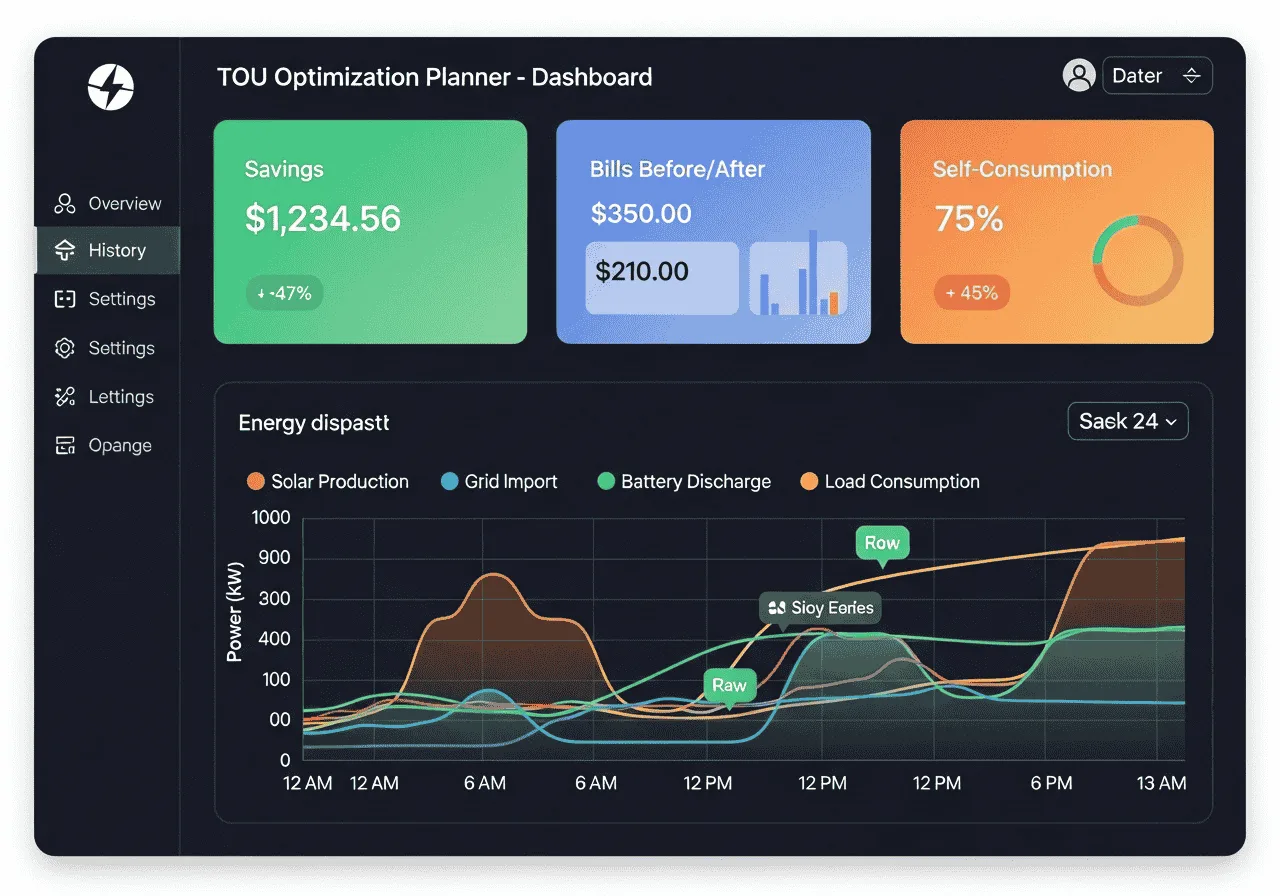
Hit calculate. You’ll get total savings, bill before and after, self-consumption percentage, and an hour-by-hour table you can export as a CSV for your smart devices.
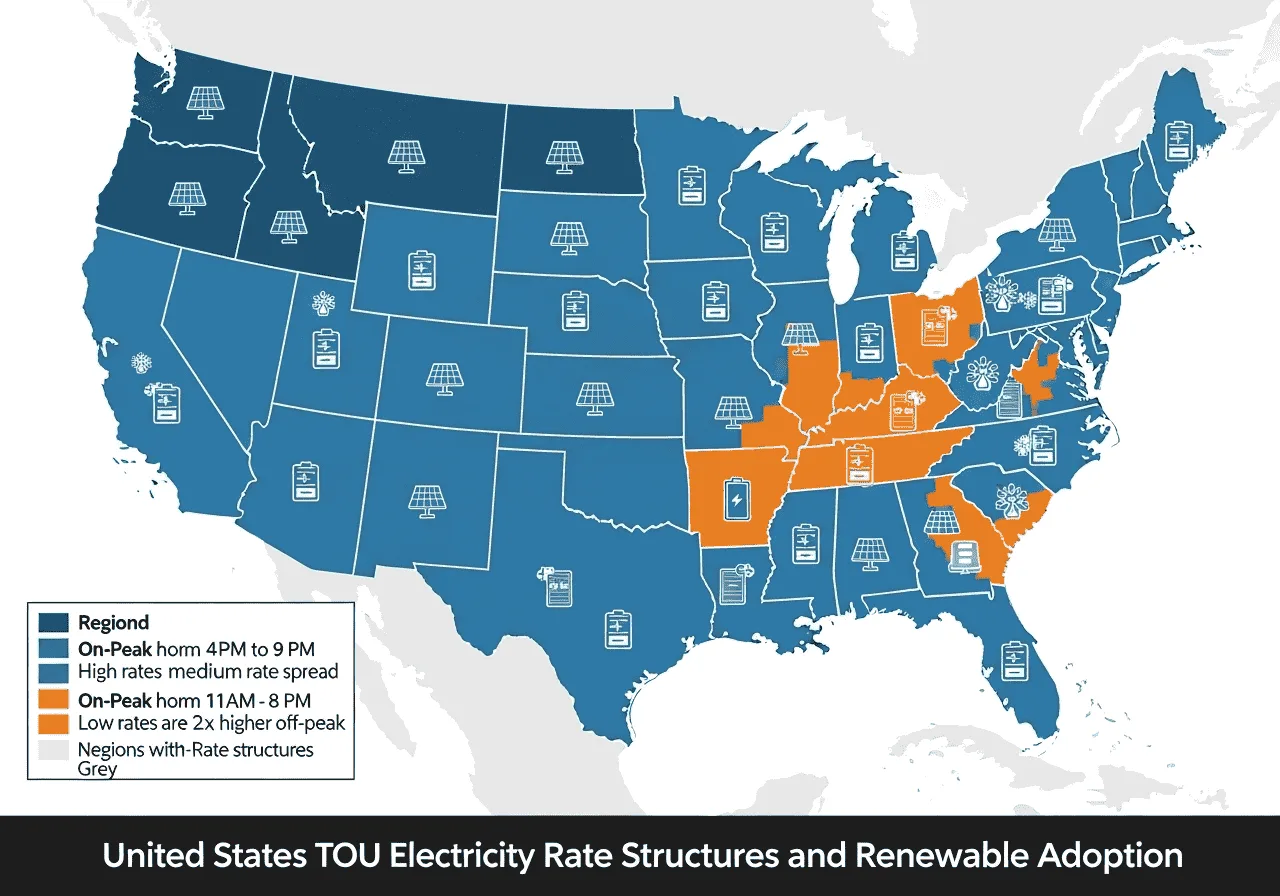
What TOU Rates Actually Look Like by Region
| Utility | Peak Rate | Shoulder Rate | Off-Peak Rate | Peak Hours |
|---|---|---|---|---|
| SCE (California) | $0.74/kWh | $0.35/kWh | $0.23/kWh | 4-9 PM |
| SDGE (San Diego) | $0.68/kWh | $0.42/kWh | $0.28/kWh | 4-9 PM |
| PG&E (California) | $0.59/kWh | $0.31/kWh | $0.25/kWh | 4-9 PM |
| Austin Energy | $0.12/kWh | – | $0.09/kWh | 2-7 PM |
| PSEG (New Jersey) | $0.21/kWh | – | $0.14/kWh | 8 AM-10 PM |
Note: Rates shown are representative residential TOU tariff examples available at the time of writing. Actual electricity prices vary by plan, season, and utility. Always verify the latest tariff with your electricity provider.
Typical residential TOU rates published by utilities at the time of writing. Rates and rate periods change; check your utility’s current tariff schedule before finalizing your inputs above.
Notice the spread. SCE customers have almost 5x the reason to shift usage that Austin Energy customers do. If you’re in a high-spread market, the payoff from getting your dispatch timing right is a lot bigger.
How Much Battery Do You Actually Need for TOU Optimization?
Size your battery to your peak-hour consumption, not your daily total. Most homes need 10-20 kWh to cover the evening peak window. A battery sized off daily average use will run dry right when rates are highest, which defeats the point.
| Battery Model | Capacity | Power | Efficiency | Warranty |
|---|---|---|---|---|
| Tesla Powerwall 2 | 13.5 kWh | 5.0 kW | 90% | 10 years |
| LG Chem RESU | 9.8 kWh | 5.0 kW | 95% | 10 years |
| Enphase IQ Battery | 10.1 kWh | 3.84 kW | 89% | 10 years |
| Sonnen EcoLinx | 20.0 kWh | 8.0 kW | 85% | 10 years |
Not sure which fits your load? Run your numbers through our Professional Solar Sizing Calculator, which sizes your panels, battery bank, and inverter together, then bring your battery capacity figure back here to model the actual dispatch savings.
Most home batteries also ship with a battery management system (BMS) that handles cell balancing and protects against over-discharge. That’s separate from the dispatch strategy this planner builds. The BMS keeps the battery safe; the planner decides when it charges and discharges.
Load Shifting Beyond the Battery
A battery does the heavy lifting, but shifting a few appliances adds up fast:
- Water heater (25-30% of home energy use): heat off-peak, save an estimated $50-80/month
- Pool pump: run during solar hours, not the evening peak, save roughly $30-50/month
- EV charging: charge off-peak or on solar excess, save around $40-70/month
- Dishwasher and laundry: schedule for shoulder or off-peak, save $15-25/month
Real Households, Real Savings
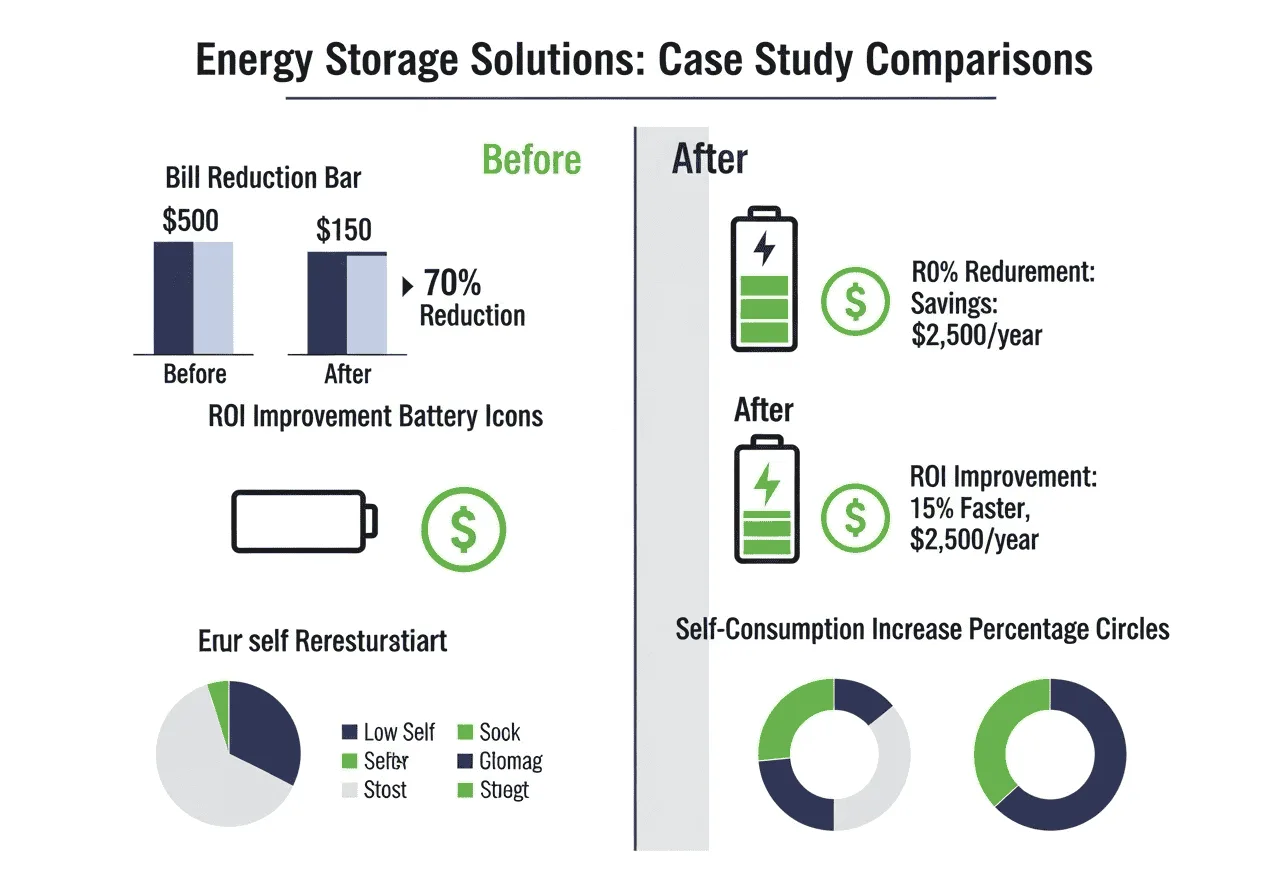
Note: the examples below are illustrative scenarios based on common residential and commercial energy profiles, not verified individual customers. Actual savings vary with your utility tariff, usage pattern, weather, battery configuration, and system design.
The Martinez Family, California
6kW solar, 15kWh battery, $280 monthly bills before optimization. After shifting EV charging off-peak and timing battery discharge to the evening rush, their bill dropped $196/month, a 70% cut. Self-consumption jumped from 40% to 85%, and battery payback shrank from 12 years to 6.
Small Business Office, Arizona
25kW solar, 40kWh battery, high AC load during peak rate hours. Pre-cooling the building during off-peak hours and timing battery discharge for peak periods produced $18,500 in annual savings and 92% solar self-consumption.
Rural Homestead, North Carolina
10kW solar, 20kWh battery, high evening loads with limited TOU program options. A custom schedule built around the available tariff still delivered 45% summer and 35% winter savings, with 78% energy independence overall.
Mistakes That Quietly Kill Your TOU Savings
Sizing the Battery to Daily Use Instead of Peak Demand
A battery sized off your daily kWh average will run empty right at 7 PM, exactly when you need it most. Size for 80-100% of your peak-hour consumption instead.
Ignoring Round-Trip Efficiency
A 10% efficiency loss is 10% less energy available when you need it. Factor real efficiency numbers into your sizing math, not the spec sheet’s best case.
Setting a Fixed Schedule and Forgetting It
Weather shifts solar output. Seasons shift your usage. Utilities occasionally shift their rate windows. A static schedule goes stale. Re-run your numbers a few times a year.
Overlooking Export Limits
NEM 3.0 and similar policies cut export compensation in some states. Some utilities also impose a hard grid export limit, a cap on how much power you’re allowed to send back regardless of price. Build your dispatch plan around your actual import tariff and export tariff, not what the old rules used to allow.
Skipping the Demand Charge
Some commercial tariffs, and a growing number of residential ones, add a separate demand charge based on your single highest 15-minute draw in the billing period. A smart inverter that staggers battery discharge can shave that peak down even when your total energy use for the day stays the same.
Ready to see your own numbers?
Calculate your personalized savings in under two minutes with the free Solar Time-of-Use Optimization Planner. No signup, no email required.
Frequently Asked Questions
What is the difference between TOU rates and standard electricity rates?
Standard rates charge the same price per kWh no matter when you use power. TOU rates change through the day, higher during peak demand (usually 4-9 PM) and lower overnight. The pricing reflects what it actually costs the grid to deliver power at that hour.
How much can I save with a solar TOU optimization calculator?
Many homeowners see 30-50% savings on their bill from solar alone. Add a properly sized, properly timed battery and some households reach 60-70%, though results vary. Your actual number depends on your rate spread, load pattern, tariff, and system size.
Do I need a battery to benefit from TOU optimization?
No. You can still save by shifting usage, laundry, EV charging, dishwashers, to match your solar generation hours. A battery unlocks the bigger savings because it lets you store cheap or excess solar and release it during the expensive evening window.
What size battery do I need for TOU optimization?
Match it to your peak-hour usage, not your daily average. Most homes need 10-20 kWh to cover the evening demand window. Run your load profile through our Professional Solar Sizing Calculator to get a specific number.
Can this calculator work with a solar system I already own?
Yes. Enter your existing system’s generation profile and your current usage pattern. If you’re considering adding a battery, the planner shows the savings and ideal battery size before you buy anything.
What happens if my utility changes its TOU schedule?
Utilities typically give 30-60 days notice before changing rate periods. Update the tariff inputs in the planner and re-run it. Your dispatch plan should be revisited whenever your utility notice arrives, not left on autopilot for years.
Is TOU optimization worth it on a small solar system?
Yes, though the dollar savings are smaller in absolute terms. The percentage savings often stay meaningful, and even a modest battery can noticeably improve your payback timeline on a small system.
Solar TOU optimization vs. a flat-rate net metering setup, which is better?
It depends on your utility’s export compensation. Where export credits are strong, flat-rate net metering can be simpler and still competitive. Where export credit is weak (like California’s NEM 3.0), a timed battery dispatch plan usually wins by a wide margin. Run both scenarios through our solar net metering calculator to compare.
Is TOU optimization worth it without net metering?
Yes, arguably more so. Without net metering, exported solar earns little or nothing, so every kWh you can shift into your own peak-hour use through battery dispatch is worth full retail value instead of a low export tariff. Energy arbitrage, storing cheap or free solar and using it during expensive hours, becomes the main source of savings rather than a bonus.
Take Control of Your Energy Bill
Solar without a timing strategy leaves money on the table every single day. The gap between what your panels produce at noon and what you pay at 7 PM is real, and it’s exactly what a solar time-of-use optimization calculator is built to close.
You’ve now got the rate tables, the battery sizing logic, and the three-pass dispatch model behind the numbers. Start by pulling your actual hourly usage from your smart meter app and your utility’s current TOU rate sheet.
Run those numbers through the planner at the top of this page, then check your figures against our Net Metering & 25-Year ROI Calculator for the full payback, NPV, and IRR picture, or our Hybrid Solar System Planner if you’re weighing backup hours and off-grid capacity too. For every other free energy tool we’ve built, visit the Energy Calculators hub, or head back to the Solvebility homepage to browse all 100+ calculators.
Last updated: July 24, 2026. Rate data sourced from published utility tariff sheets (SCE, SDGE, PG&E, Austin Energy, PSEG) and the U.S. Energy Information Administration. Next review: January 2027.
Written by Nouman Ahmed
Civil Engineer • Solar Energy Consultant • Software Developer
Nouman is the founder of Solvebility, with practical experience in solar PV system design, engineering calculations, and calculator development since 2011. This tool was built by Nouman and reviewed by the Solvebility engineering team to verify formulas, assumptions, and calculation accuracy before publication — and is updated whenever industry standards change.