

Cronbach's Alpha Calculator
Paste, drop, or upload a CSV (header row = item names). Get alpha, a confidence interval, and per-item diagnostics — instantly.
1. Your data
2. Results
Item-Total Statistics
Items with a corrected item-total correlation below 0.30, or where removal raises alpha, are flagged for review.
Cronbach’s Alpha Calculator: Free Online Reliability Tool
You built a 12-item survey, collected 200 responses, and now you’re staring at a spreadsheet wondering if the thing you built actually measures what you think it measures. That’s the exact problem a Cronbach’s alpha calculator solves.
Running the math by hand means item variances, a total-score variance, and enough steps to make a real result feel shaky by the time you’re done. Most people don’t have SPSS open on a random Tuesday night, and the free calculators floating around online often spit out a number with zero explanation of what it means or whether 0.65 is good enough for a thesis committee.
You’ll walk away from this guide knowing exactly what Cronbach’s alpha measures, how the calculator turns raw survey data into that score, and how to read the result without a statistics degree.
The formulas and thresholds below trace back to Cronbach’s original 1951 paper in Psychometrika and the interpretation guidance researchers and journal reviewers still cite today.

What Is Cronbach’s Alpha?
Cronbach’s alpha is a statistic that measures internal consistency: how closely a group of survey or test items hang together as a single scale. Scores range from 0 to 1. Most researchers treat 0.70 as the minimum acceptable score, though the right threshold depends on your field and how the results get used.
Lee Cronbach published the formula in 1951, building on earlier split-half reliability methods from the 1930s and 40s. Instead of splitting your scale in half one way and calling it done, alpha essentially averages every possible split-half correlation into a single number.
Here’s the part that trips people up: Cronbach’s alpha measures reliability, not validity. A scale can score 0.90 on alpha and still fail to measure what it claims to measure. Reliability tells you the items are consistent with each other. Validity tells you whether those items capture the actual construct, like anxiety, job satisfaction, or brand trust.
Run alpha before you touch your main analysis. A low score means you should look hard at your items before you draw conclusions from the data they produced.
How Does a Cronbach’s Alpha Calculator Work?
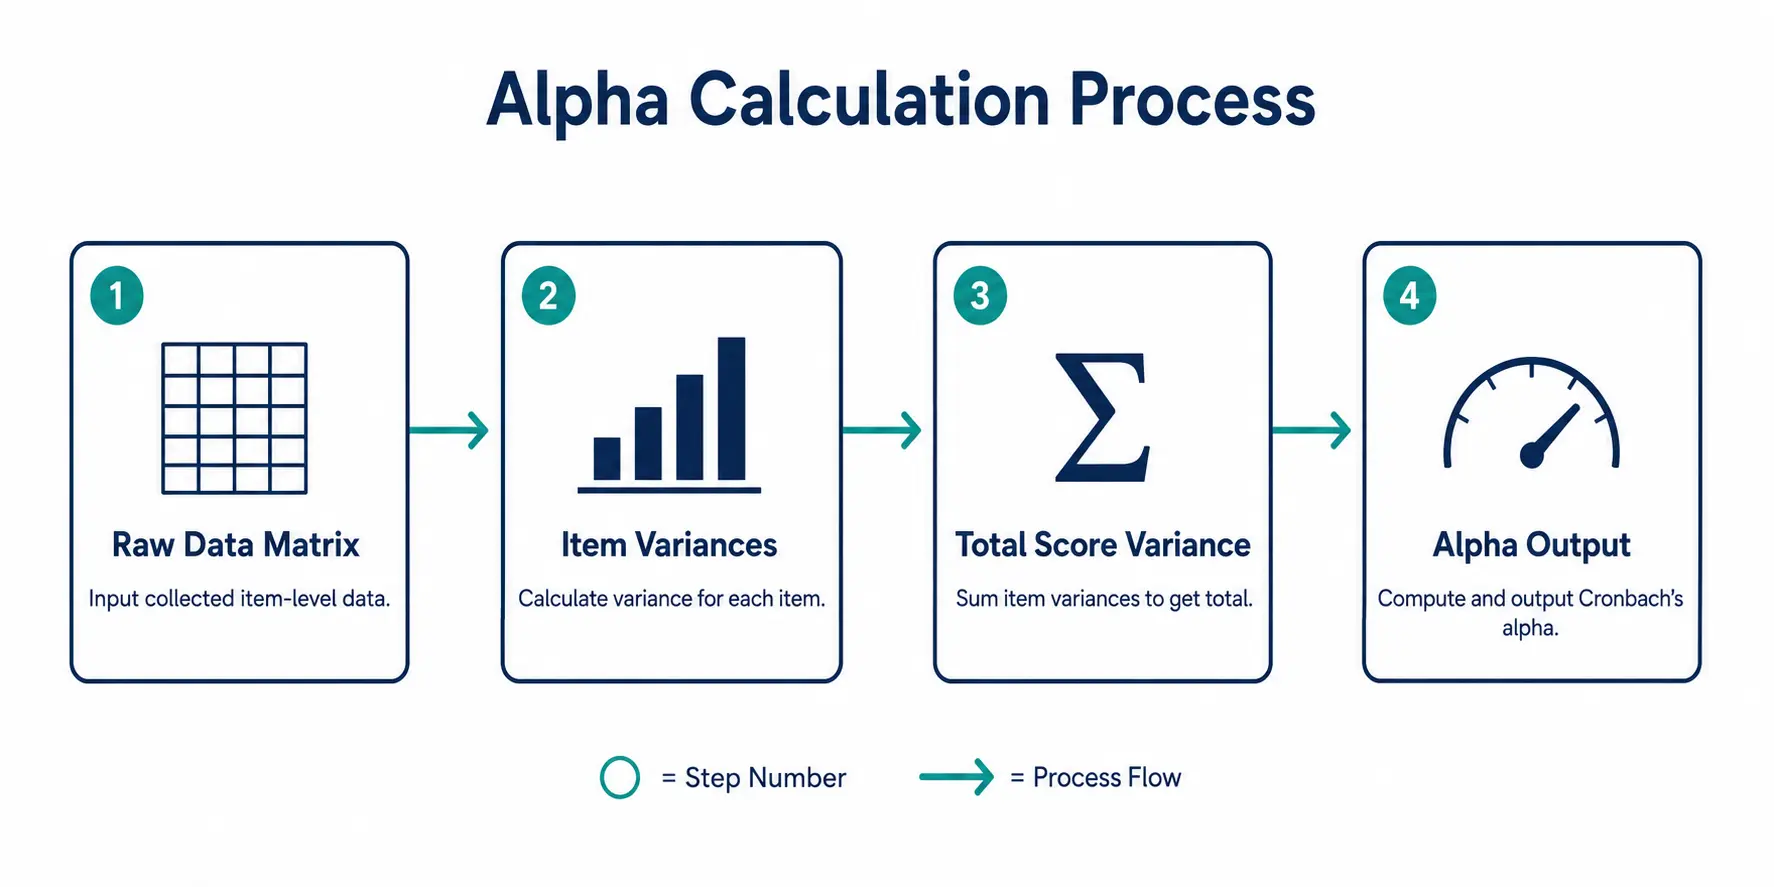
A Cronbach’s alpha calculator takes your raw item scores, each respondent’s answer to each question, computes the variance of every item and the variance of the total score, then plugs those numbers into the alpha formula. You get a single reliability coefficient in seconds instead of working through the variance math by hand.
Feed the calculator a data matrix: one row per respondent, one column per item. For a 10-item Likert scale with 150 respondents, that’s 1,500 individual scores. The calculator computes the variance for each of the 10 columns, sums those variances, then calculates the variance of the row totals, each respondent’s summed score across all 10 items.
Elena, a psychology master’s student in Barcelona, ran her 8-item motivation scale through a calculator last spring and got an alpha of 0.81 in under a minute. Doing it by hand in a spreadsheet took her professor’s teaching assistant almost 40 minutes the semester before, and he still made a rounding error.
The calculator also flags item-total correlations, which show whether any single item is dragging the whole scale down. That’s usually the number worth checking first if your overall alpha comes back lower than you hoped.
How to Calculate Cronbach’s Alpha Step by Step
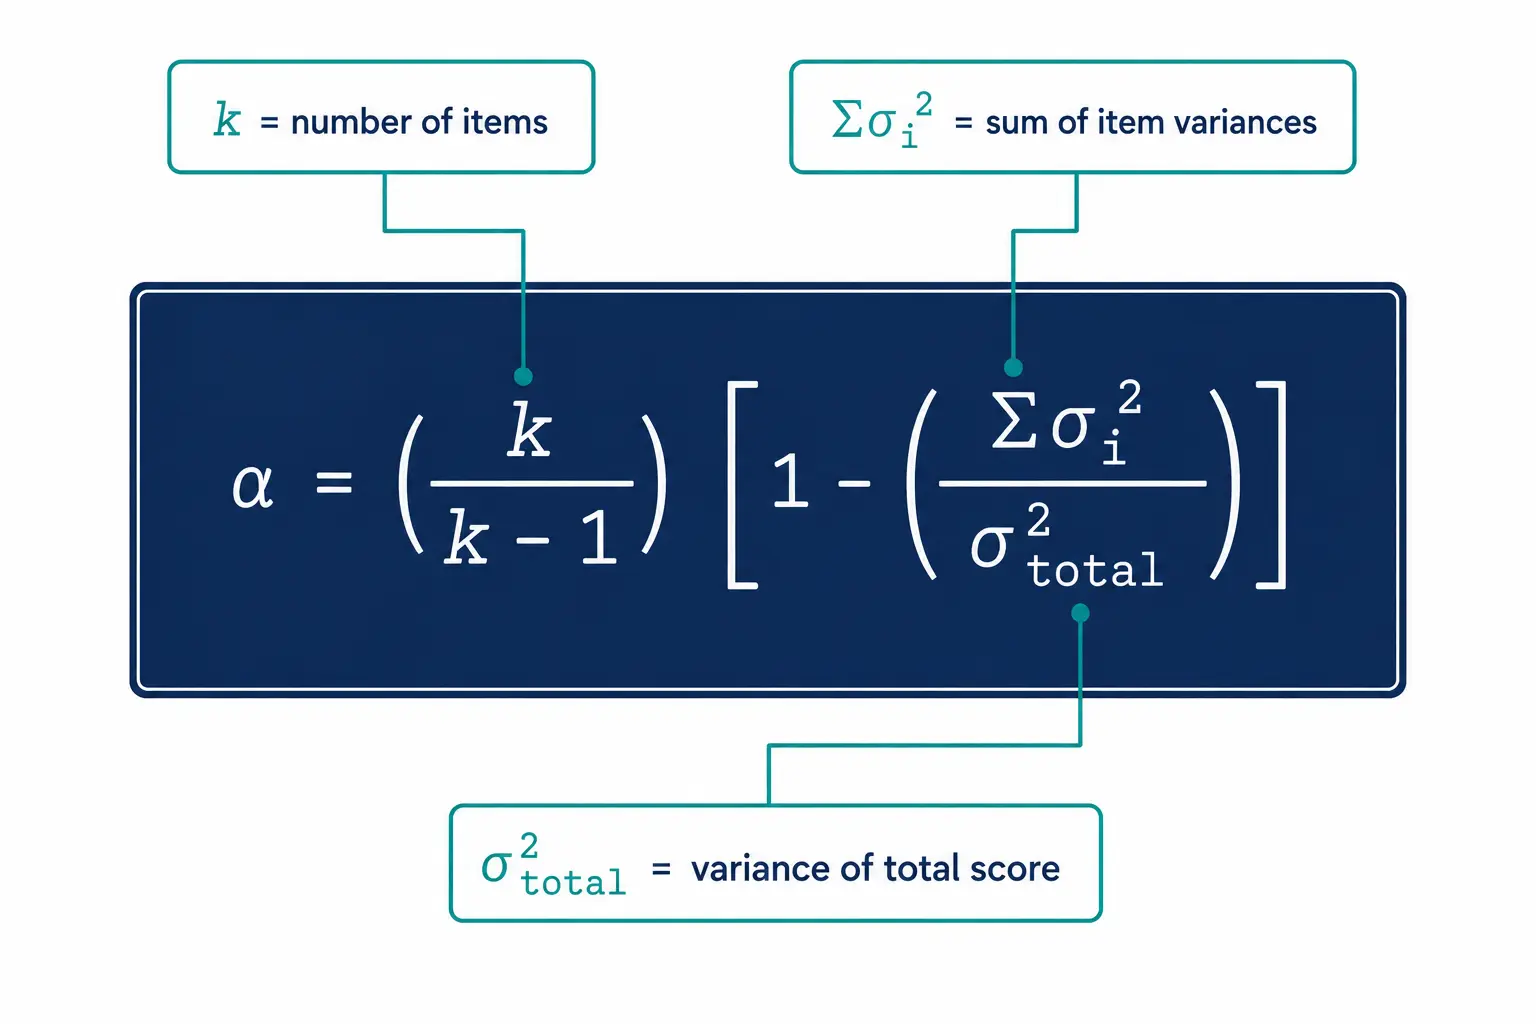
To calculate Cronbach’s alpha, you need the number of items (k), the variance of each item, and the variance of the total score. Plug those into the formula below. A calculator automates every step once you enter your raw data.
- Collect your item-level data. Build a spreadsheet with one row per respondent and one column per survey item.
- Reverse-code where needed. Any item worded in the opposite direction, like “I rarely feel stressed” on a stress scale, needs to be flipped before you calculate anything.
- Calculate each item’s variance. Find the variance of the scores within each column.
- Sum the item variances. Add up every individual item variance from step 3.
- Calculate the total score variance. Sum each respondent’s scores across all items, then find the variance of those totals.
- Apply the alpha formula. Divide k by (k − 1), then multiply by 1 minus the ratio of summed item variance to total variance.
- Check item-total correlations. Confirm no single item correlates poorly with the rest of the scale before you report your final number.
If your standard deviation calculator already has your item-level data loaded, you can pull the variances straight from there instead of recalculating them by hand.
How Do You Interpret Your Cronbach’s Alpha Score?
Below 0.50 is unacceptable, 0.50 to 0.69 ranges from poor to questionable, 0.70 to 0.89 is good, and above 0.90 is excellent, though scores above 0.95 can signal redundant items rather than a stronger scale.
| Alpha Value | Interpretation | What to Do |
|---|---|---|
| Below 0.50 | Unacceptable | Redesign or remove items |
| 0.50–0.59 | Poor | Use with caution, revise items |
| 0.60–0.69 | Questionable | Acceptable for exploratory work |
| 0.70–0.79 | Acceptable | Standard threshold for most research |
| 0.80–0.89 | Good | Solid for published research |
| 0.90–0.94 | Excellent | Strong internal consistency |
| 0.95 or higher | Excessive | Check for redundant or near-duplicate items |
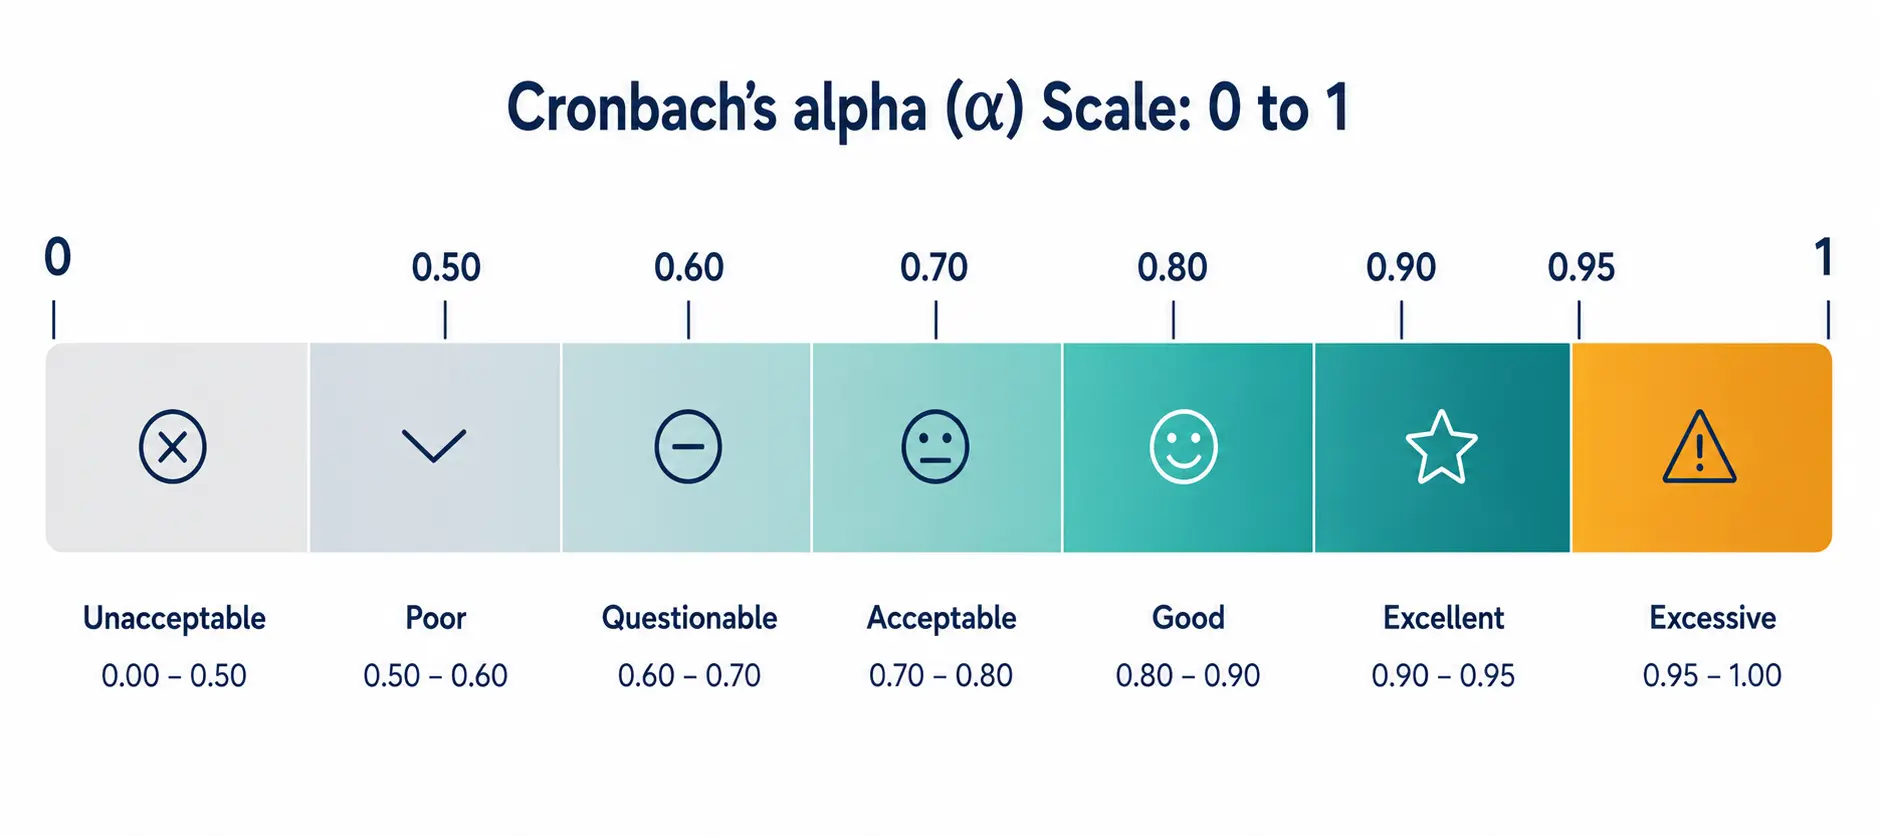
The 0.70 cutoff comes from Jum Nunnally’s recommendation for early-stage, exploratory research. Fields with higher stakes, like clinical assessment or licensing exams, often expect 0.80 or above. A is worth running before you collect data, since a small sample can make your alpha estimate bounce around from one study to the next even when the scale itself is fine.
Don’t chase a perfect score, either. Researchers at the University of Virginia’s library data team point out that alpha above 0.95 usually means your items are too similar to each other, not that your scale is unusually strong. Trim overlapping questions before you re-run the analysis.
Why Is Your Cronbach’s Alpha Score Low?
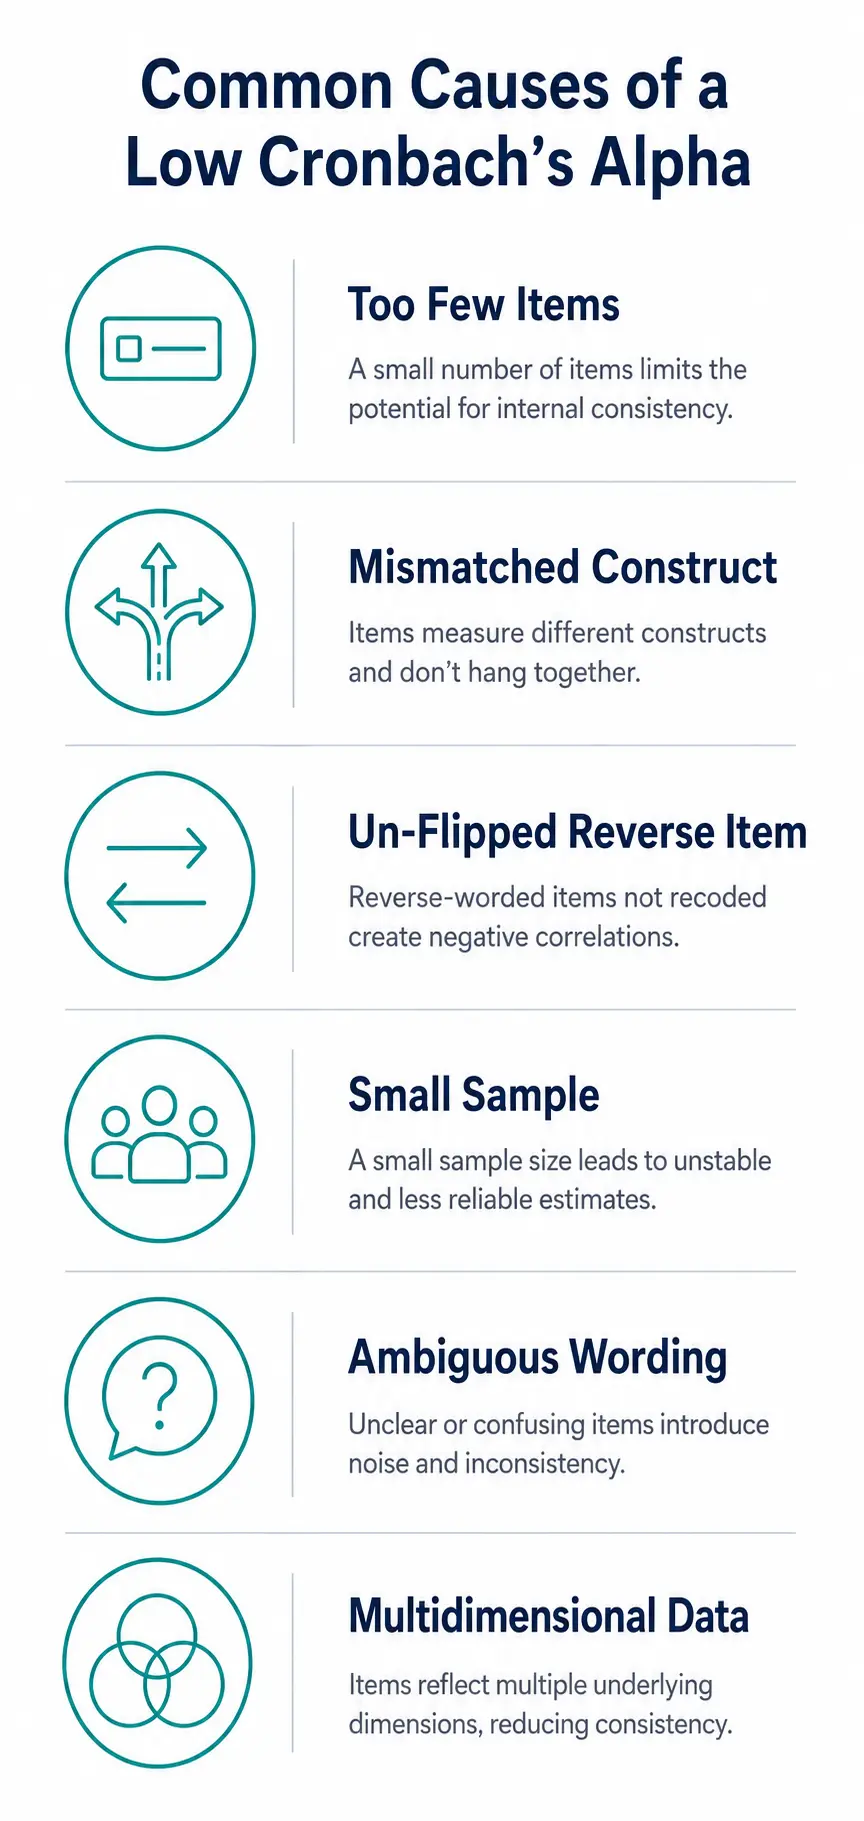
A handful of causes explain most low scores:
- Too few items on the scale (alpha naturally climbs as you add well-correlated items)
- Items that don’t tap the same underlying construct
- A reverse-coded item that never got flipped before analysis
- A small or inconsistent sample
- Wording ambiguous enough that respondents interpret it differently
- Multidimensional data forced into a single alpha score
If one item’s item-total correlation sits below 0.30, re-run alpha without it. If the score jumps noticeably, that item is the problem, not your whole scale.
James, a market researcher in Toronto, saw his customer-satisfaction scale come back at 0.58 twice in a row. It turned out one item asked about price and another about service speed, two different things dressed up as one scale. Splitting them into two subscales fixed it, and both subscales cleared 0.75 on their own.
Cronbach’s Alpha vs Other Reliability Measures: Which Should You Use?
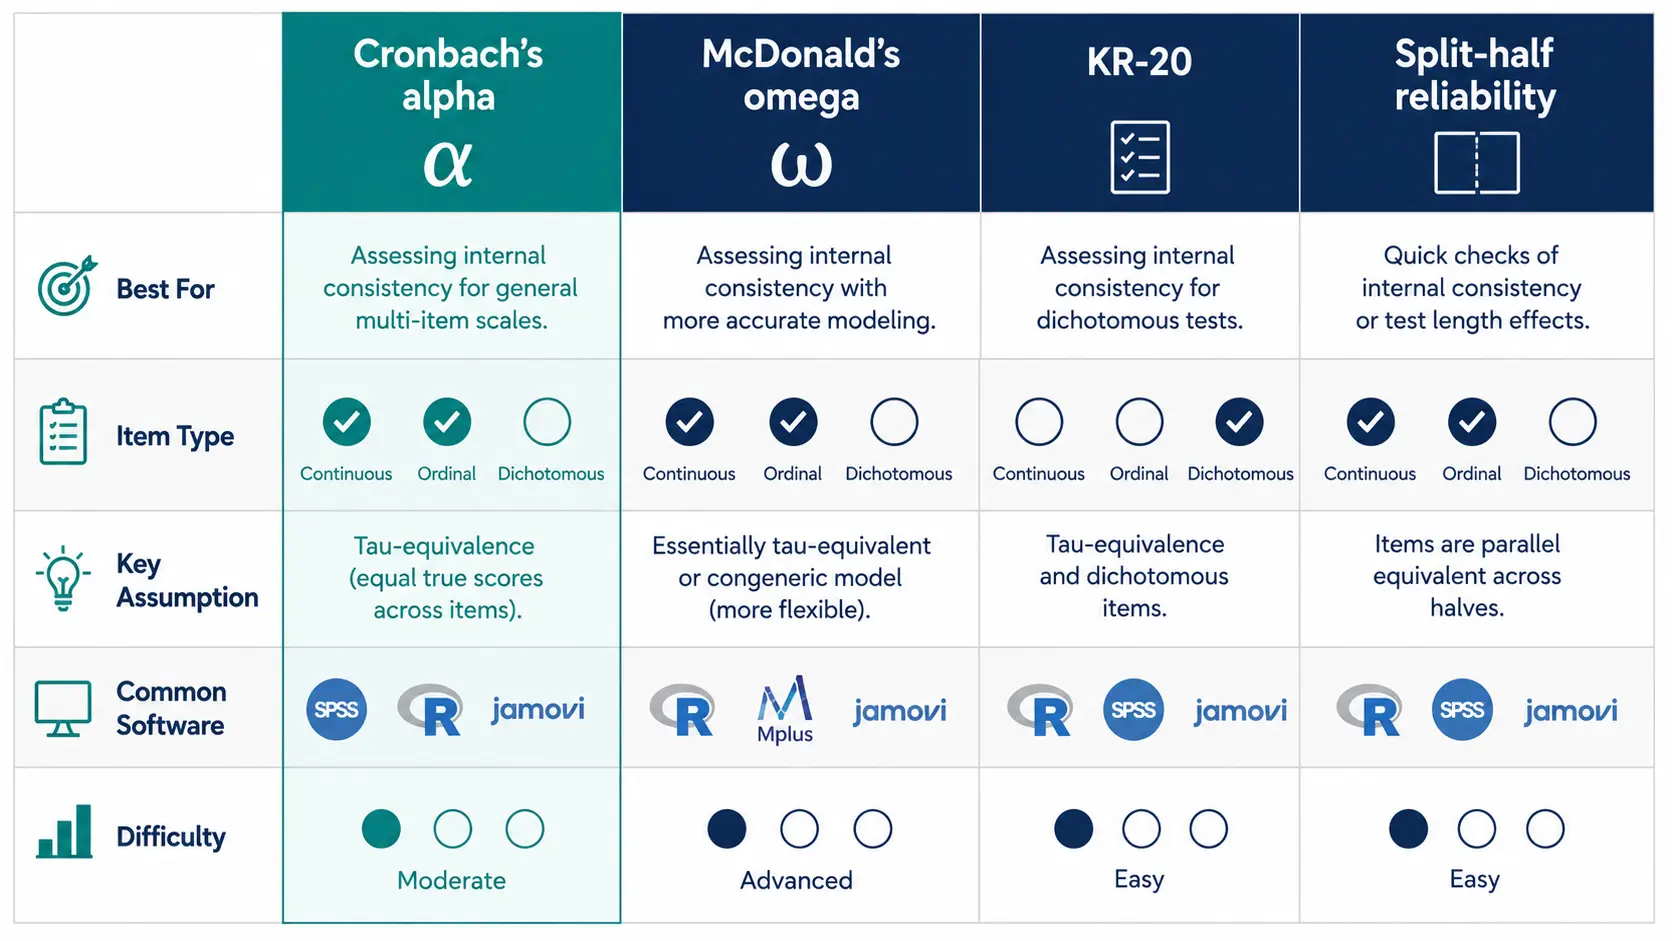
Cronbach’s alpha works well for unidimensional scales with continuous or Likert-type items. McDonald’s omega handles multidimensional scales better, KR-20 is built for binary items, and split-half reliability is the older, simpler method alpha was designed to replace.
| Measure | Best For | Key Assumption | Typical Use Case |
|---|---|---|---|
| Cronbach’s alpha | Continuous / Likert items | Tau-equivalence across items | Survey and questionnaire scales |
| McDonald’s omega | Multidimensional scales | Factor loadings can vary | Complex psychological constructs |
| KR-20 | Binary (right/wrong) items | Dichotomous scoring | Multiple-choice tests |
| Split-half | Any item type | Two equivalent halves | Quick, rough reliability check |
Alpha remains the default in SPSS, R, and most online tools mostly because of history. A widely cited review by Tavakol and Dennick, published in the International Journal of Medical Education, notes that alpha is one of the most frequently reported statistics in the social sciences and among the most poorly understood. It’s a good starting point, not a stat you should report blindly without checking your data first.
Frequently Asked Questions
What is a good Cronbach’s alpha score?
A score of 0.70 or higher is generally considered acceptable for most research. Values from 0.80 to 0.90 are considered good to excellent, and scores above 0.95 often point to redundant items rather than a stronger scale.
How many items do I need for Cronbach’s alpha?
You need at least 3 items to calculate alpha, though most reliable scales use 5 to 10 or more. Alpha tends to rise as you add items, so a longer scale isn’t automatically a better one.
Can Cronbach’s alpha be negative?
Yes. A negative alpha usually means an item correlates negatively with the rest of the scale, most often because a reverse-worded item wasn’t recoded before analysis. Check your reverse-coded items first if you see a negative result.
Does sample size affect Cronbach’s alpha?
Sample size doesn’t change the formula, but it affects how stable your estimate is. A scale tested on 20 people can show a very different alpha than the same scale tested on 300, even if the items themselves haven’t changed.
Is 0.6 an acceptable Cronbach’s alpha?
A 0.6 sits in the questionable range. It’s often tolerated in early, exploratory research but usually needs revision before publication in most peer-reviewed journals.
What’s the difference between Cronbach’s alpha and reliability?
Reliability is the broader concept: how consistent a measurement is. Cronbach’s alpha is one specific way to estimate reliability, focused on internal consistency, alongside other methods like test-retest and split-half reliability.
Cronbach’s alpha vs test-retest reliability, what’s the difference?
Cronbach’s alpha checks whether your items agree with each other at one point in time. Test-retest reliability checks whether the same people give similar answers when you test them again weeks later. They measure different kinds of consistency.
Can I calculate Cronbach’s alpha in a spreadsheet?
Yes, using the VAR function on each column and on the row totals, then applying the alpha formula manually. It works, but a dedicated calculator saves time and cuts down on the rounding errors that creep into manual spreadsheet formulas.
Start Testing Your Scale’s Reliability
Cronbach’s alpha won’t tell you if your scale measures the right construct, but it will tell you whether your items are pulling in the same direction. Run the numbers before you report results, watch for scores that are suspiciously high or low, and use item-total correlations to fix problem questions instead of scrapping a whole scale.
You now have what you need to run a Cronbach’s alpha calculation, read the output, and explain it to a supervisor or reviewer who asks why 0.72 is good enough. Start by loading your item-level data into the calculator above and checking where your score lands on the interpretation table.
References
- Cronbach, L. J. (1951). Coefficient alpha and the internal structure of tests. Psychometrika, 16(3), 297–334. Springer
- Tavakol, M., & Dennick, R. (2011). Making sense of Cronbach’s alpha. International Journal of Medical Education, 2, 53–55. NIH / PMC
- University of Virginia Library. Using and Interpreting Cronbach’s Alpha. UVA Library