

Crop Nutrients Requirement Calculator
From Calculator to Field: Turning Your NPK Numbers Into a Fertilizer Plan
The calculator above tells you that your wheat needs 227 kg of nitrogen per hectare. Good. Now what? You can’t walk into a farm supply store and ask for “227 kg of nitrogen.” You need bags of Urea, DAP and MOP, and you need to know when to apply them.
That gap between a nutrient requirement number and an actual fertilizer order is where a lot of the calculator’s value gets lost. This guide closes that gap. It covers how to convert your N-P₂O₅-K₂O-S results into real product quantities, when to split applications, how to read early deficiency symptoms in the field, and what changes if you’re farming in Saskatchewan versus southern Spain.
What the Calculator’s Numbers Actually Mean
Two numbers get confused constantly: nutrient removal and nutrient requirement. Removal is what the crop physically pulls out of the soil and carries away in grain, straw, or fiber. Requirement is what you need to apply, which is always higher, because fertilizer never converts to plant uptake at 100%.
That’s the whole point of the recovery efficiency slider. A wheat crop might only remove 125 kg N/ha, but at 55% recovery, you’re applying 227 kg N/ha because roughly 45% of it leaches, volatilizes, or binds to soil before the plant ever touches it.
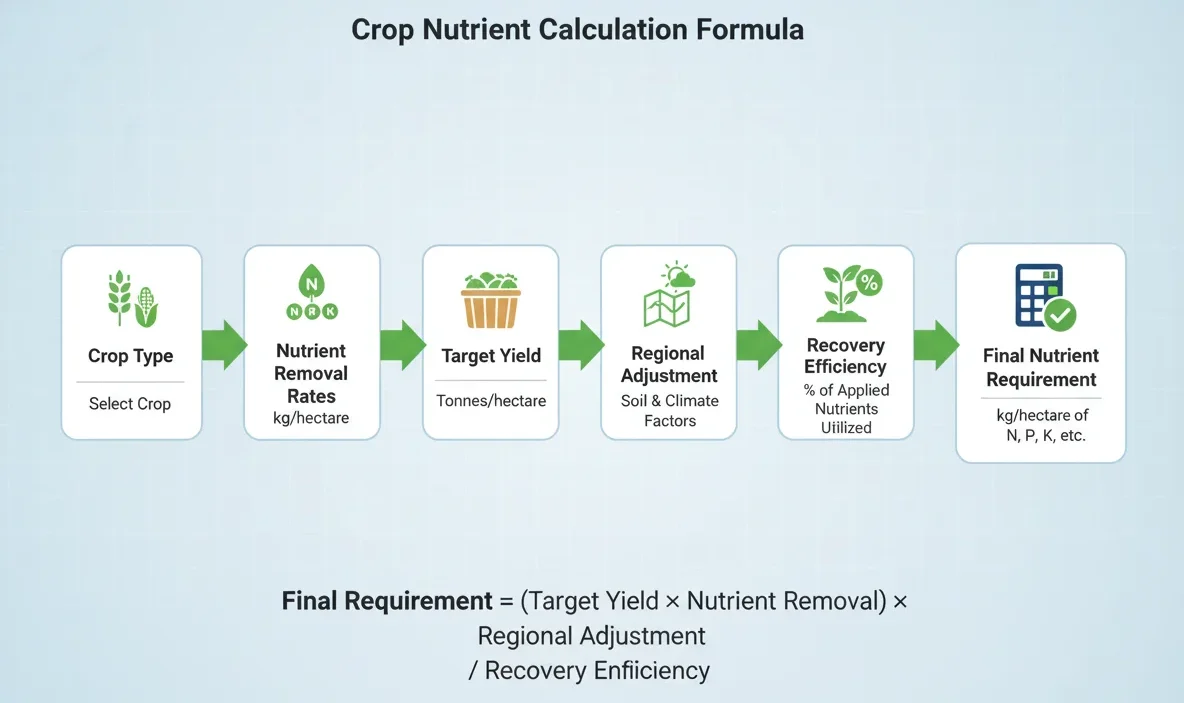
Once you understand that distinction, the calculator’s output stops looking like an abstract number and starts looking like a purchasing decision.
Converting kg/ha Into Urea, DAP and MOP Bags
Straight nutrient math turns into a shopping list with one formula:
Fertilizer product needed (kg) = Nutrient requirement (kg) ÷ Nutrient content of product (%)
The catch is overlap. DAP supplies both nitrogen and phosphorus, so if you’re buying DAP for your P₂O₅ need, it’s already contributing some nitrogen too. You have to subtract that before topping up with Urea.
| Product | N % | P₂O₅ % | K₂O % | S % |
|---|---|---|---|---|
| Urea | 46 | 0 | 0 | 0 |
| DAP (Diammonium Phosphate) | 18 | 46 | 0 | 0 |
| MAP (Monoammonium Phosphate) | 11 | 52 | 0 | 0 |
| MOP (Muriate of Potash) | 0 | 0 | 60 | 0 |
| SOP (Sulfate of Potash) | 0 | 0 | 50 | 18 |
| SSP (Single Super Phosphate) | 0 | 16 | 0 | 12 |
| Ammonium Sulfate | 21 | 0 | 0 | 24 |
| Gypsum (as S source) | 0 | 0 | 0 | 18 |
Worked example: Maize at 8 t/ha, USA region, 55% recovery
Running maize through the calculator’s formula gives:
- N: 147 kg/acre
- P₂O₅: 71 kg/acre
- K₂O: 177 kg/acre
- S: 29 kg/acre
Here’s how that turns into an order:
- Cover P₂O₅ with DAP first: 71 ÷ 0.46 ≈ 154 kg DAP/acre. This also supplies 154 × 0.18 ≈ 28 kg N.
- Top up nitrogen with Urea: 147 − 28 = 119 kg N still needed → 119 ÷ 0.46 ≈ 259 kg Urea/acre.
- Cover K₂O with MOP: 177 ÷ 0.60 ≈ 295 kg MOP/acre.
- Cover sulfur with gypsum or ammonium sulfate: 29 ÷ 0.18 ≈ 161 kg gypsum/acre, or fold it into your ammonium sulfate rate if you’re already using it for nitrogen.
That’s roughly 154 kg DAP, 259 kg Urea, 295 kg MOP, and a separate sulfur source, per acre. Multiply by your total acreage for the season’s order.
Should You Trust the Number Without a Soil Test?
Think of the calculator as the demand side of the equation. Your soil test is the supply side. Skip the soil test and you’re applying full-rate fertilizer on top of whatever residual nitrogen, phosphorus and potassium is already sitting in your profile from last season’s crop, manure, or compost.
A soil test report showing 40 ppm of available phosphorus, for instance, usually means you can cut your calculated P₂O₅ rate by 30 to 50%. High-potassium soils (200+ ppm) often support a 40 to 60% cut in K₂O. Nitrogen is trickier because it moves through the soil fast, but most extension labs will still give you a pre-plant nitrate credit.
Land-grant universities in the US, Canadian provincial ag ministries, and Australian state agriculture departments all run subsidized or low-cost soil testing labs. In most of Europe, testing runs through national or regional agricultural chambers. None of it costs more than a fraction of what over-applying fertilizer costs you across a season.
When to Split Applications, and Why It Matters
Nitrogen is the nutrient that punishes patience the least. A single pre-plant dose sits in the soil for weeks before the crop can use much of it, and every week it sits there is a week it can leach past the root zone or volatilize into the air, particularly on sandy soils or after heavy rain.
Phosphorus and potassium are more stable and usually go down as a single basal (pre-plant) application, since they don’t move through the soil profile the way nitrogen does.
| Timing | Share of Total N | Growth Stage | Why |
|---|---|---|---|
| Basal (pre-plant) | ~35% | Before or at planting | Gets the crop established, alongside full P₂O₅ and K₂O |
| First top-dress | ~35% | Tillering / V4–V6 | Matches the crop’s rapid vegetative uptake window |
| Second top-dress | ~30% | Booting / pre-tassel | Feeds grain-fill and protein development, cuts late-season losses |
This split pattern is also the mechanism behind the 4R Nutrient Stewardship framework (right source, right rate, right time, right place), which most US, Canadian and European extension programs now recommend as standard practice, not an optional upgrade.
Spotting Deficiency Before Yield Drops
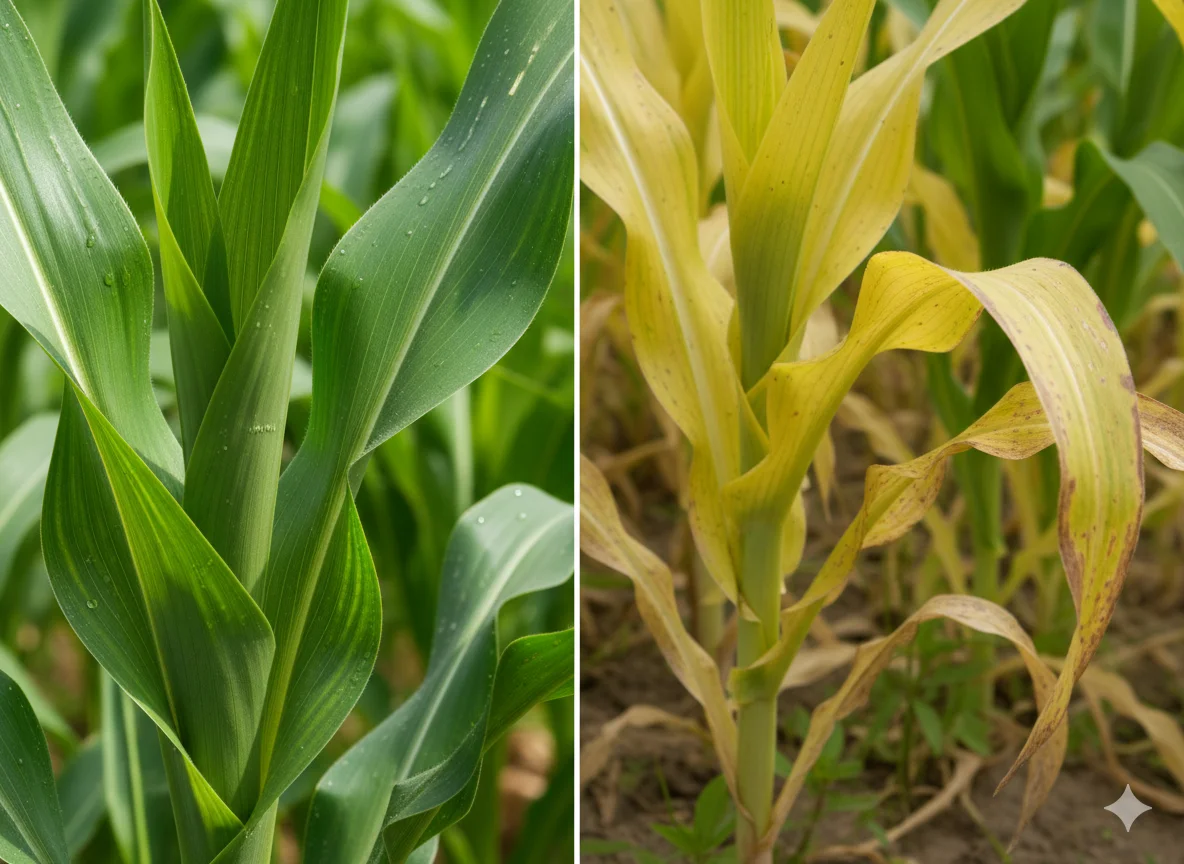
By the time a calculator would tell you something’s wrong, the crop already told you weeks earlier. Field scouting during the vegetative stage catches problems while there’s still time to correct them with a top-dress application.
| Nutrient | First Sign | Where It Appears | Common Cause |
|---|---|---|---|
| Nitrogen (N) | Uniform yellowing, thin stand | Older, lower leaves first | Leaching, under-application |
| Phosphorus (P₂O₅) | Purple/reddish leaf tinge, weak roots | Whole plant, worse early season | Cold soils, low soil P, wrong placement |
| Potassium (K₂O) | Yellow-brown scorched leaf margins | Older leaves first | Sandy soils, heavy crop removal |
| Sulfur (S) | Pale yellowing, similar to N but newer leaves | Youngest leaves first | Low organic matter, sandy soils, low-S fertilizer blends |
Sulfur deficiency gets missed most often because it mimics nitrogen deficiency. The tell is the leaf position: nitrogen shows up on the bottom of the plant first, sulfur shows up on top. Mix that up and you’ll top-dress with Urea when what the field actually needed was gypsum or ammonium sulfate.
USA, Canada, Australia and Europe: What’s Different
Farming the same crop at the same yield target in Nebraska and in the Netherlands does not mean buying the same fertilizer order.
- USA: Recovery efficiency defaults around 55%. NRCS’s nutrient management standard (Code 590) shapes most state-level recommendations, and it’s typically voluntary unless you’re enrolled in a conservation program.
- Canada: Efficiency defaults slightly lower, around 50%, largely because of a shorter growing season and more variable spring conditions across the Prairies. 4R Nutrient Stewardship is heavily promoted by provincial extension services.
- Australia: Recovery efficiency runs lower still, around 45%, driven by older, often sodic or acidic soils and lower, more erratic rainfall in the major cropping belts.
- Europe: Recovery efficiency is typically highest, around 60%, thanks to well-managed soils and consistent rainfall, but the EU Nitrates Directive legally caps nitrogen application in designated “nitrate vulnerable zones,” regardless of what your calculator says you need.
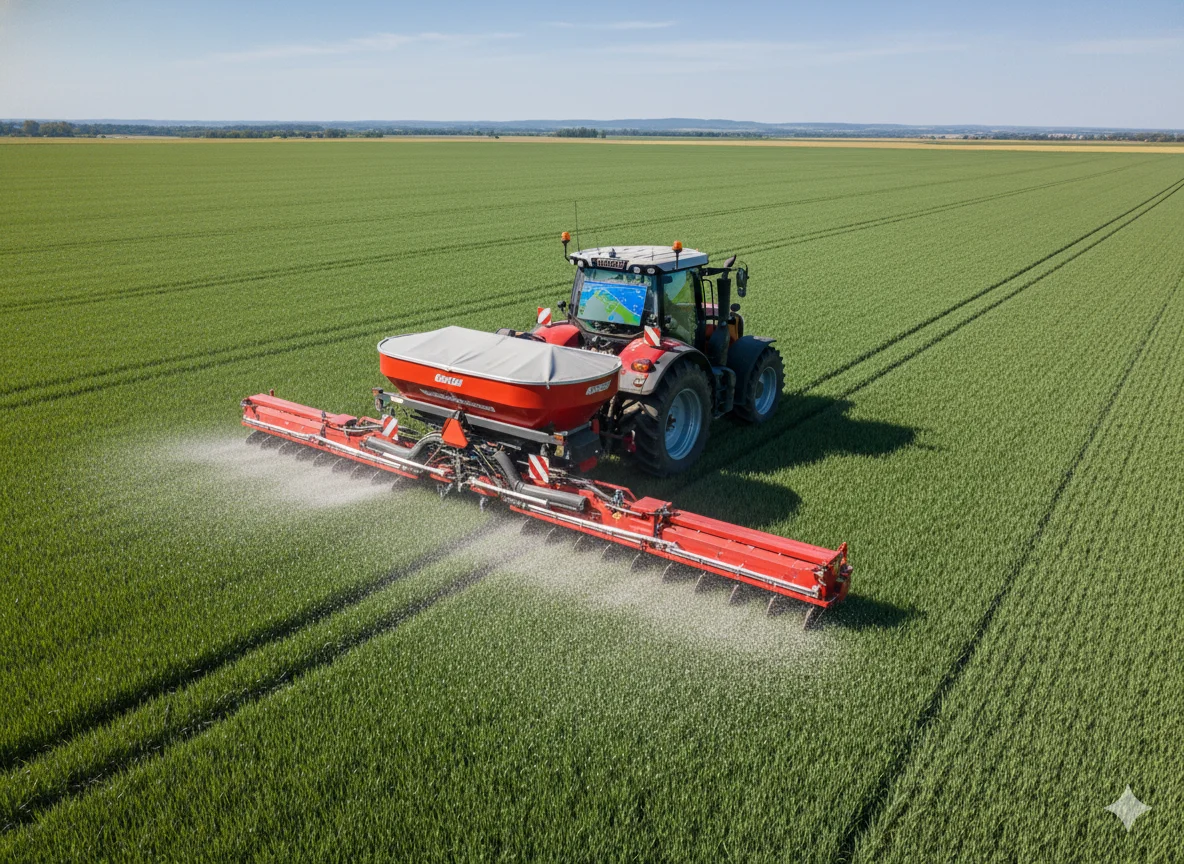
If you’re farming in a nitrate vulnerable zone in the EU, run the calculator, then check your number against your zone’s legal application cap before you order anything. The regulation wins the argument, not the formula.
Five Mistakes That Waste Fertilizer Money
- Skipping the soil test. You end up paying full price for phosphorus and potassium your field already has.
- Dumping all the nitrogen pre-plant. A heavy spring rain a week after planting can wash away a third of it before the crop ever needs it.
- Ignoring sulfur. Standard NPK blends often skip it entirely, and sandy, low-organic-matter soils are showing sulfur deficiency more often as regional air-quality improvements cut atmospheric sulfur deposition.
- Using the default recovery efficiency forever. If you’ve upgraded to variable-rate spreading, split applications, or better irrigation timing, your real recovery efficiency is probably higher than the regional default. Update the slider and your fertilizer bill drops.
- Not re-running the numbers after a rotation change. Following soybeans with corn changes your nitrogen credit substantially. Recalculate every season, not just once.
FAQs on Applying Your Calculator Results
Divide your nitrogen requirement in kg by 0.46 (Urea is 46% nitrogen). A 200 kg N/ha requirement needs roughly 435 kg of Urea per hectare. If some of your nitrogen is already coming from DAP or ammonium sulfate, subtract that nitrogen first before calculating the remaining Urea amount.
The calculator’s default output assumes zero starting phosphorus in the soil. If your soil test shows medium to high phosphorus, you need to manually reduce the calculator’s number, typically by 30 to 50% for high-P soils, since the tool doesn’t read your soil test automatically.
Split it, especially on sandy soils or in high-rainfall regions. A common pattern is roughly a third at planting, a third at tillering or V4-V6, and the rest at booting or pre-tassel. Splitting raises your effective recovery efficiency without increasing the total amount you buy.
Uniform yellowing that starts on the older, lower leaves and a generally thin, pale stand compared to neighboring healthy areas. If the yellowing shows up on the newest top leaves instead, that’s more likely a sulfur deficiency, not nitrogen.
No, this tool covers only the four major nutrients: nitrogen, phosphorus, potassium and sulfur. Micronutrient needs (zinc, boron, iron, manganese) depend heavily on local soil chemistry and should be checked through a separate soil or tissue test, especially for high-value crops.
The EU Nitrates Directive sets a legal cap on nitrogen application in designated nitrate vulnerable zones, regardless of what a calculator recommends. US and Canadian nutrient management guidance is mostly voluntary best-practice, tied to conservation program eligibility rather than a blanket legal limit.
The current crop list is built around major field and row crops with well-documented FAO/ICAR removal rates. Forage and hay crops remove nutrients differently across multiple cuttings, so treat any pasture estimate from this tool as a rough starting point and confirm with a forage-specific extension guide.
Removal is the nutrient physically taken out of the field in the harvested crop. Requirement is the amount of fertilizer you need to apply, which is always higher, because a portion of every application is lost to leaching, volatilization or soil fixation before the plant absorbs it.
Your nutrient requirement number is the start of the plan, not the whole plan. Convert it into real products, split the nitrogen, watch the crop for early signs of trouble, and check your local rules before the order goes in. That’s the difference between a calculator result and a fertilizer program that actually pays for itself.
Nutrient removal rates and recovery efficiency ranges reference FAO Fertilizer Use by Crop guidelines, ICAR nutrient management research, and USDA NRCS nutrient management technical standards. Fertilizer product compositions (Urea, DAP, MOP, SOP, SSP) reflect standard commercial grades; confirm exact analysis on your supplier’s label before ordering, as regional formulations can vary slightly.