

Compare Solar vs Grid Costs Calculator
See Your 5, 10, and 20-Year Savings
Estimate total lifetime cost of grid electricity vs a proposed solar system — including escalation, inflation, maintenance and break-even year.
Your 20-Year Energy Cost Outlook
Cumulative cost timeline
Savings by horizon
Insight & Actions
Run calculations to get personalized insights. The tool highlights break-even year and likely savings, and suggests prioritized actions (e.g. increase system size, improve self-consumption).
Scenario Comparison
Toggle low/high inflation to see sensitivity of savings and break-even year.
Your electric bill probably went up again this year. It always does. That’s usually the real reason people search for a solar vs grid cost calculator, not curiosity, but a bill that keeps climbing and an installer’s pitch that sounds a little too good to be true.
The calculator above gives you your numbers. This guide explains what’s actually behind them: how grid rates escalate, what a solar system costs once incentives kick in, and when your break-even point really arrives.
How This Solar vs Grid Cost Calculator Works
You enter four things: your monthly kWh usage, your current rate (in USD, EUR, or AUD), your proposed photovoltaic (PV) system’s cost and size, and an escalation rate for how fast grid prices rise. From there it runs the math for 5, 10, and 20-year horizons.
We keep the assumptions visible on purpose. Maintenance is modeled as a percentage of system cost per year, escalating alongside inflation. The tool doesn’t factor in financing interest, state-specific rebates, panel degradation, or net metering payouts by default, because those vary too much by location and equipment to guess accurately. If you’re financing your system, add your loan’s interest cost on top of the number the calculator gives you.
6 Steps to Run Your Own Solar vs Grid Comparison
- Find your monthly kWh usage. Pull it from your last 12 electric bills, or your smart meter, and average it.
- Enter your current utility rate. Choose USD, EUR, or AUD and enter the rate per kWh shown on your bill.
- Enter your proposed system size and cost per watt. Use a real installer quote if you have one, in kW and total dollars.
- Set your escalation rate. 3% is a reasonable default; use your utility’s actual rate history if you know it.
- Set your maintenance percentage. 0.5-2% of system cost per year covers cleaning, monitoring, and eventual inverter replacement.
- Pick your horizon and hit calculate. Compare your 5, 10, and 20-year break-even year and total savings.
What Actually Drives Your Solar vs Grid Savings
Two homeowners with identical roofs can get completely different results. Here’s what moves the needle most.
| Factor | Why it matters | Typical range |
|---|---|---|
| Local electricity rate | Higher rates mean solar pays back faster | $0.08–$0.32/kWh (US) |
| Escalation / inflation | Even 1-2 points of difference compounds hard over 20 years | 1.5%–5% annually |
| System cost (all-in) | Panels, inverter, labor, permits, usually quoted per watt | $2–$3.50 per watt |
| State/utility incentives | Directly cuts your upfront cost, varies a lot by location | No federal residential credit in 2026, state-dependent |
| Maintenance | Small annual cost, but it’s real | 0.5%–2% of system cost/year |
| Net metering policy | Determines value of excess power you export | Varies heavily by utility |
| Self-consumption rate | How much of your own solar output you use vs. export, batteries raise this | 30%–70% |
A Real Example: Grid vs Solar Over 5, 10, and 20 Years
Take a homeowner using 950 kWh a month at $0.13/kWh, roughly a $125 monthly bill. A 7kW system runs about $21,000 installed. This example assumes the system went in before January 1, 2026, when the 30% federal residential credit still applied, bringing the net cost to about $14,700.
Run that through the calculator with 3% annual escalation and 1.2% maintenance, and here’s roughly what the pre-2026 example produced:
| Horizon | Grid-only cost | Solar cost | Net result |
|---|---|---|---|
| 5 years | ~$7,960 | ~$16,700 | Solar hasn’t broken even yet |
| 10 years | ~$17,400 | ~$17,700 | Near break-even |
| 20 years | ~$40,500 | ~$21,200 | ~$19,300 saved |
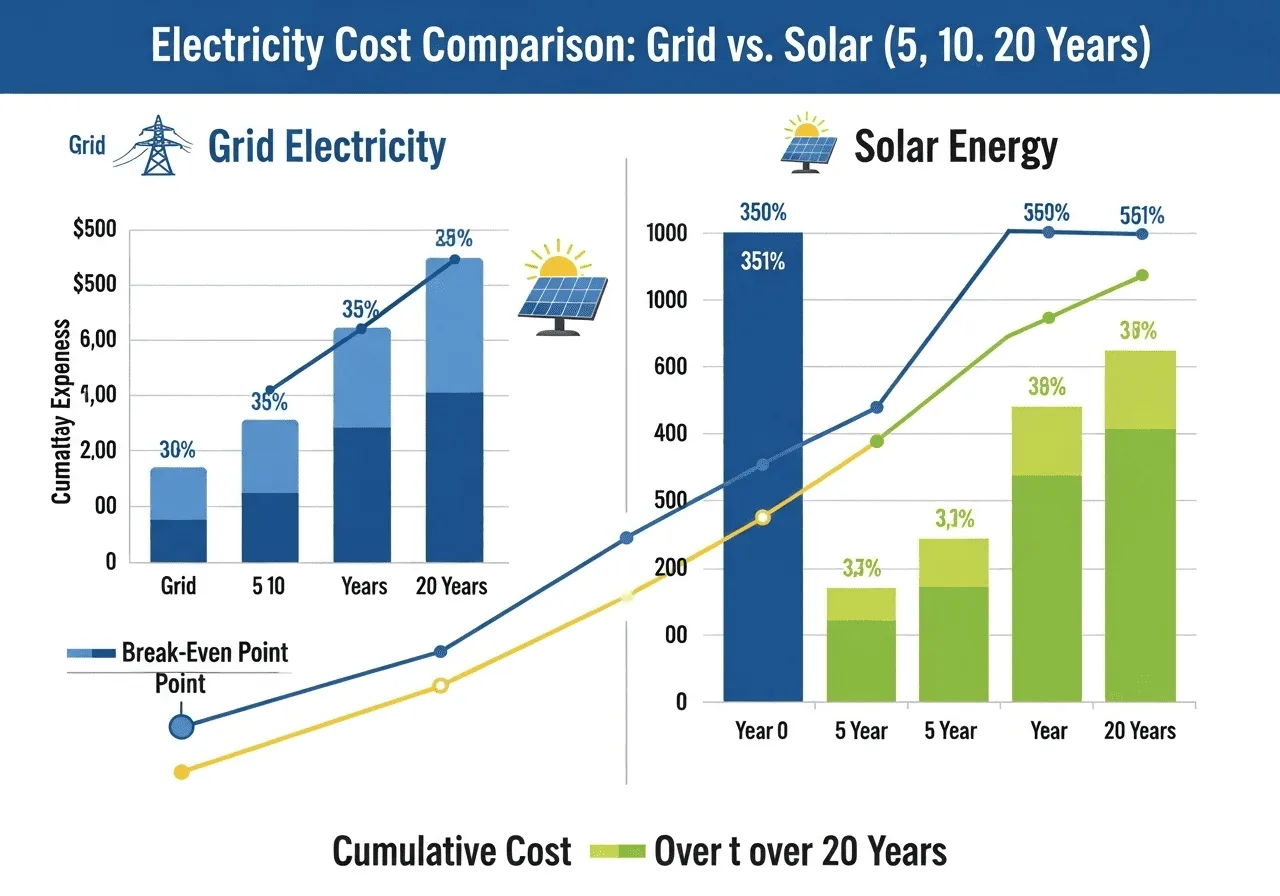
Grid costs climb every year. Solar costs mostly stop after year one. That gap is where the savings live.
Notice year 5 looks disappointing. That’s normal, not a red flag. Solar is a long-horizon bet, and the payoff shows up in years 10 through 20, not year 2.
The Number That Actually Matters: $/kWh Solar vs $/kWh Grid
Most online tools bury this number. It’s the cleanest comparison you can make: your utility charges you per kWh, so your solar system should be judged the same way. Solar analysts call this your levelized cost of energy (LCOE), the true lifetime cost of every kWh your panels produce.
A $14,700 system producing 10,000 kWh a year over 25 years works out to roughly $0.06/kWh, once you include maintenance. Compare that to a grid rate of $0.13-$0.20/kWh, and the case for solar gets a lot more concrete than “you’ll save thousands.”
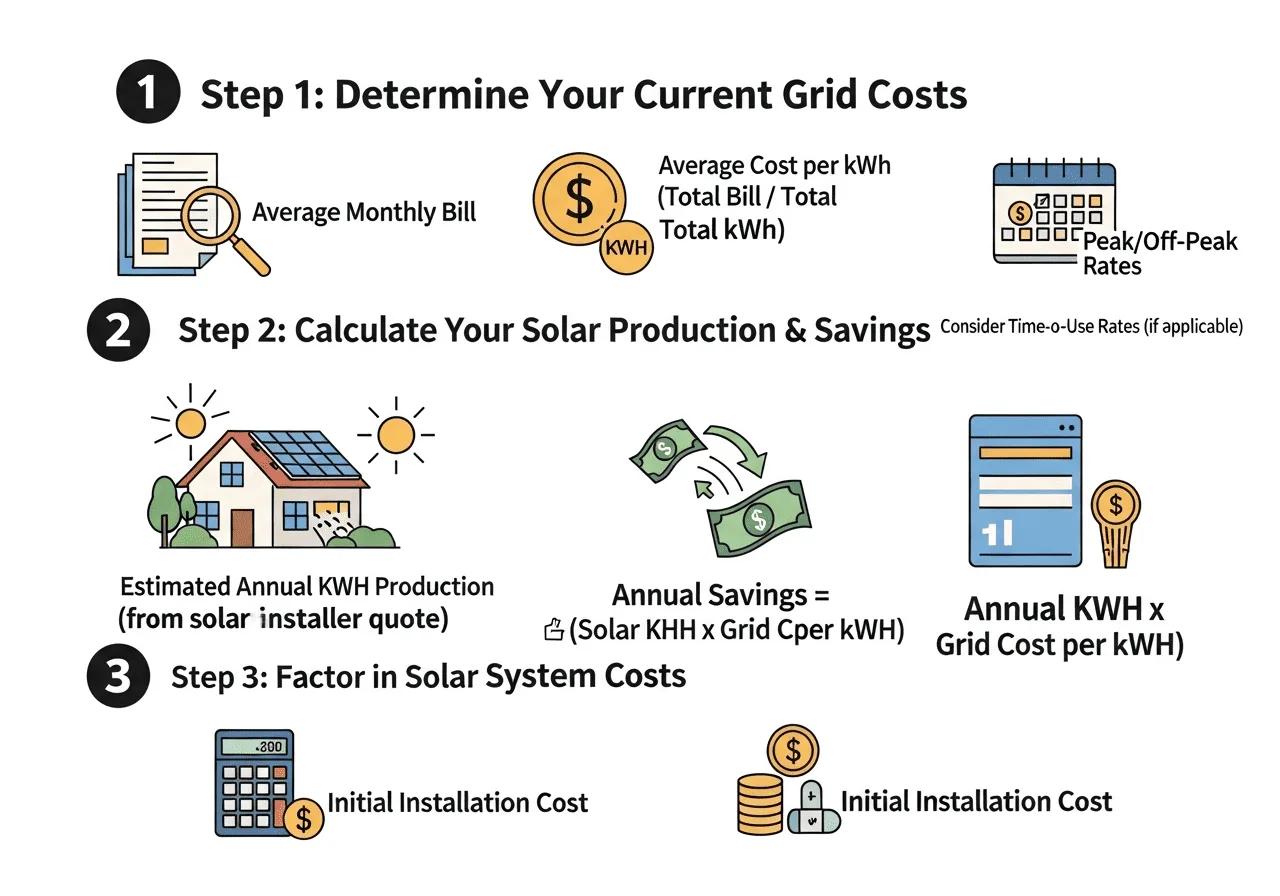
The point where the two lines cross is your break-even year, everything after that is money back in your pocket.
When Does Solar Become Cheaper Than Grid Electricity?
The U.S. Energy Information Administration expects residential electricity prices to keep climbing 3-5% a year through 2050. That escalation is the whole game. A flat rate today feels manageable, but compounded over two decades it adds up fast, and it’s exactly what makes solar’s fixed upfront cost look better with each passing year.
Mistakes People Make Comparing Solar to Grid Costs
- Using today’s rate for 20 years of math. Rates almost never stay flat. Always model escalation, even a conservative 2%.
- Ignoring maintenance and panel degradation. It’s small, but skipping inverter replacement and the roughly 0.5% yearly output drop inflates your savings on paper.
- Forgetting financing interest. A $20,000 system on a 7% loan can effectively cost $23,500+ over 10 years. Cash purchases look better on paper for a reason.
- Assuming the 30% federal tax credit still applies. It expired for owned residential systems on December 31, 2025. Only leases and PPAs still reach a credit indirectly through the installer.
- Assuming every state’s incentives are identical. Net metering and rebates vary a lot by utility, not just by country.
- Sizing the system for today’s usage only. An EV or a home addition down the line changes your math. Slight oversizing is usually cheaper than a second install later.
Comparing Solar vs Grid Costs in USD, EUR, and AUD
Rates in Sydney don’t behave like rates in Toronto, and rates in Berlin don’t behave like rates in Texas. That’s why the calculator above lets you switch between USD, EUR, and AUD instead of forcing US assumptions on a Canadian, European, or Australian household.
If you’re in Europe or Australia, your grid rate is likely already higher than the US average, which usually means a shorter break-even period. If you’re in a lower-rate US state, the math takes longer to tip in solar’s favor, and that’s worth knowing before you sign anything. Either way, energy independence and rate protection carry real value even when the pure dollar math is close.
Ready to run your own numbers?
Scroll back up, enter your usage and rate, and get your personal break-even year in under a minute. Then check your system sizing and battery needs with our other free tools.
Explore all free calculators on SolvebilityRelated Calculators
- Solar net metering calculator, see what your exported power is actually worth under your utility’s plan.
- Hybrid solar system planner, model a grid-tied system with battery backup instead of grid-only vs solar-only.
- Battery sizing calculator, figure out how much storage you’d need to raise your self-consumption rate.
- Solar watt-hour calculator, get a more precise production estimate before you finalize system size.
- Browse the full Energy Calculators library on Solvebility for more tools like these.
Frequently Asked Questions
What is a solar vs grid cost calculator?
It’s a tool that projects two cost curves side by side, what you’d pay for grid electricity versus what you’d pay for a solar system, over a chosen time horizon. It shows your break-even year and total savings based on your own usage and rate.
How accurate are solar vs grid cost calculators?
They’re accurate for the assumptions you give them. Small tools using average national data can be off by 10-20%. For a tighter estimate, use your real monthly kWh usage, your actual rate, and a realistic installed quote rather than a rough guess.
Why should I compare solar vs grid costs before buying a system?
Because installer quotes can be optimistic. Running your own numbers first gives you a baseline to sanity-check any sales pitch, and it shows you exactly which inputs, rate, escalation, system size, move your savings the most.
When is solar the right choice compared to staying on the grid?
Solar tends to make sense if your rate is above roughly $0.12/kWh, your roof gets decent sun, and you plan to stay in the home 7+ years. Below that rate, or with a short timeline, the payback period often stretches past what most people find worthwhile.
How much does solar cost compared to 20 years of grid electricity?
A typical residential system runs $18,000-$30,000 installed in 2026, since the 30% federal tax credit expired at the end of 2025 for owned systems. Twenty years of grid electricity at a modest 3% escalation often totals $35,000-$50,000 for an average household, which is where most of solar’s long-term savings come from.
Solar vs grid: which is cheaper long term?
Solar wins for most homeowners over a 15-20 year horizon, mainly because grid rates keep rising while your solar cost is mostly locked in after installation. Short term, grid is usually cheaper, that flips once you cross your break-even year.
Is solar worth it if my area has low electricity rates?
It can still work, but the payback period is longer. In low-rate regions, solar tends to make more sense if you also get strong incentives, favorable net metering, or plan to stay in the home long enough to pass break-even.
What if my electricity usage changes after I install solar?
Usage often creeps up over time, an EV, a home office, a growing family. Systems can be expanded later, but it’s usually cheaper to size a bit generously upfront than to add a second installation down the road.
References
- U.S. Energy Information Administration, Electricity Data and Rate Projections
- National Laboratory of the Rockies, formerly NREL, PVWatts Solar Production Methodology
- Internal Revenue Service, Home Energy Tax Credits, current Residential Clean Energy Credit status
- Lawrence Berkeley National Laboratory, Electricity Markets & Policy Research
Written by Nouman Ahmed
Civil Engineer • Solar Energy Consultant • Software Developer
Nouman is the founder of Solvebility, with practical experience in solar PV system design, engineering calculations, and calculator development since 2011. This tool was built by Nouman and reviewed by the Solvebility engineering team to verify formulas, assumptions, and calculation accuracy before publication — and is updated whenever industry standards change.