

Fertilizer Dose Calculator: Exact NPK Rates for Every Crop
Stop eyeballing bags of Urea and DAP. Get the precise N, P₂O₅ and K₂O dose your crop actually needs, in kg/ha or lbs/acre, with a formula agronomists actually use.
Inputs
Fertilizer Mapping Table
| Fertilizer | N% | P₂O₅% | K₂O% | Cost per 50kg | Actions |
|---|

Two hundred sixty kilograms of Urea per hectare sounds precise, until half of it volatilizes before your wheat ever touches it. That’s the reality for growers still eyeballing rates from memory or last year’s invoice.
A fertilizer dose calculator replaces that guesswork with math. Feed it your crop’s nitrogen, phosphorus and potassium targets, and it works backward to the exact kilograms (or pounds) of Urea, DAP, MOP, or whatever’s in your shed, so you stop paying for nutrients your field never gets to use.
This guide walks through the formula behind the numbers, a step-by-step calculation you can run today, regional NPK tables for the US, Canada, Australia and Europe, and a split-application schedule you can copy straight into your field notebook.
The USDA’s Natural Resources Conservation Service ties over-application directly to nitrate runoff and wasted input spend1. Get the dose right and you fix both problems in one pass.
What Is a Fertilizer Dose Calculator?
Treat your soil test like a shopping list and the calculator like the checkout math. You already know the kilograms of N, P₂O₅ and K₂O your crop needs. The tool figures out how many bags of Urea, DAP or MOP actually deliver that, without you doing algebra in a truck cab.
Most calculators, Solvebility’s included, juggle three layers at once: how much of each nutrient a fertilizer actually contains, how much of what you spread the crop actually absorbs, and how the math changes when one product supplies more than one nutrient. DAP is the classic example, it hands you nitrogen and phosphorus in the same bag. Miss that overlap and you’ll oversupply nitrogen without realizing it.
Why Nitrogen, Phosphorus and Potassium Each Do a Different Job
- Nitrogen (N) drives leaf and stem growth. Short it and corn turns pale before it even tassels.
- Phosphorus (P₂O₅) builds roots, flowers and seed. Skip it and wheat grows tall with thin, hollow grain.
- Potassium (K₂O) manages water movement and stress tolerance. You won’t notice the shortfall until drought or frost hits and the crop can’t cope.
The International Plant Nutrition Institute notes that phosphorus shortfalls often cut yield well before any visible leaf symptom shows up2, which is exactly why guessing is expensive: by the time you see the problem, the yield’s already gone.
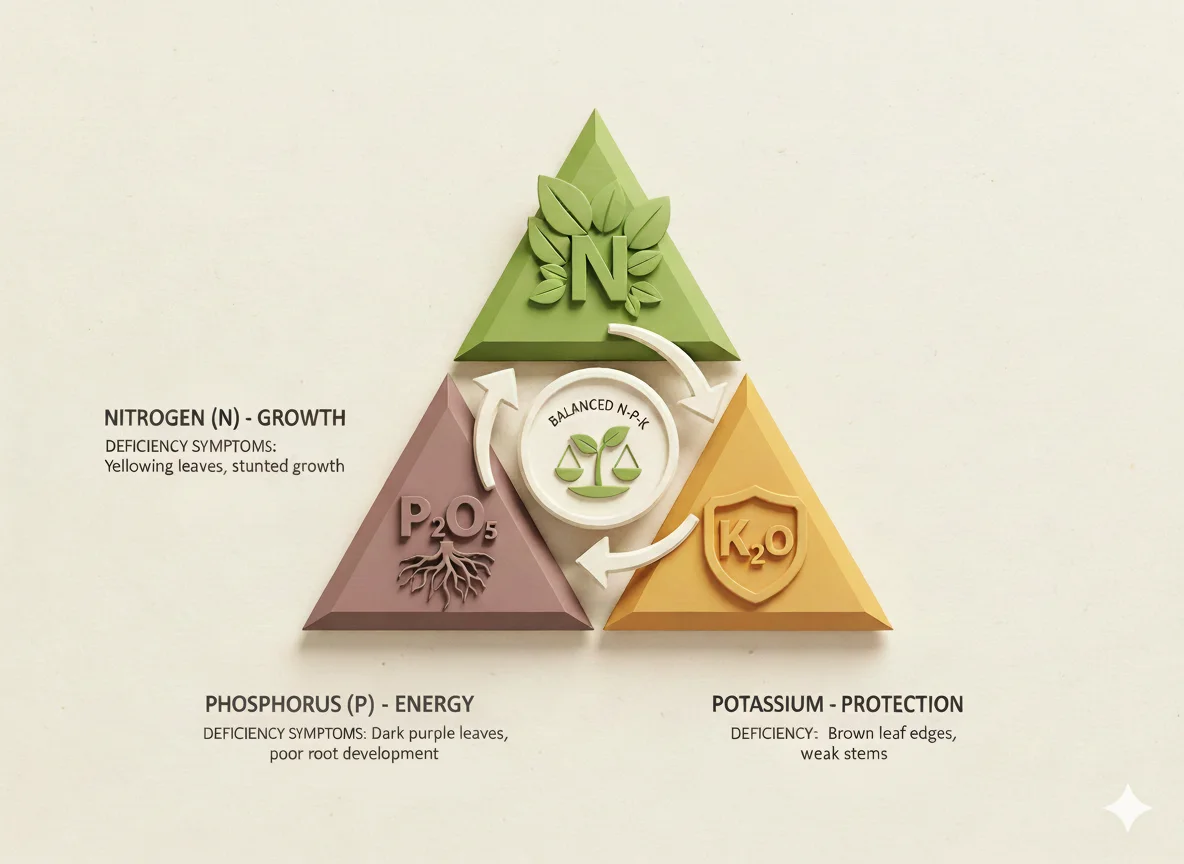
The NPK triangle: nitrogen for growth, phosphorus for roots and seed, potassium for stress resilience.
How Does a Fertilizer Dose Calculator Work?
Say your soil test calls for 120 kg/ha of nitrogen and you’re applying Urea, which runs 46% N. Divide 120 by 46, multiply by 100, and you land on 260.9 kg/ha of Urea. Simple enough on paper.
Real fields complicate it fast. Not every kilogram of nitrogen you spread reaches the plant. University extension data puts nitrogen use efficiency around 50 to 70% under typical field conditions, phosphorus lower still, and potassium usually the steadiest of the three3.
If your efficiency sits at 70%, that 120 kg N target effectively becomes 120 ÷ 0.70 = 171 kg/ha before you’ve even touched the fertilizer-percentage math.
Add a second and third fertilizer, DAP for phosphorus, MOP for potassium, and you’re solving three equations at once, because DAP contributes nitrogen too. Doing that by hand invites mistakes. A calculator runs the linear algebra in the background and hands you a clean, checkable number.
How Do I Calculate Fertilizer Dose Step by Step?
- Pull your nutrient targets from a recent soil test or a regional crop guide (see the table below).
- List the fertilizers available to you locally, along with their N-P₂O₅-K₂O percentage and price per bag.
- Set nutrient use efficiency for your soil type and irrigation method. 70-85% for nitrogen is a reasonable starting point across most of the US Midwest.
- Enter a purity correction if you suspect your product isn’t 100% pure. Most commercial bags run 95-100%.
- Add a split percentage if your crop benefits from staged application. Corn and wheat both do.
- Run the calculation and check the “achieved nutrients” output against your original targets before you buy anything.
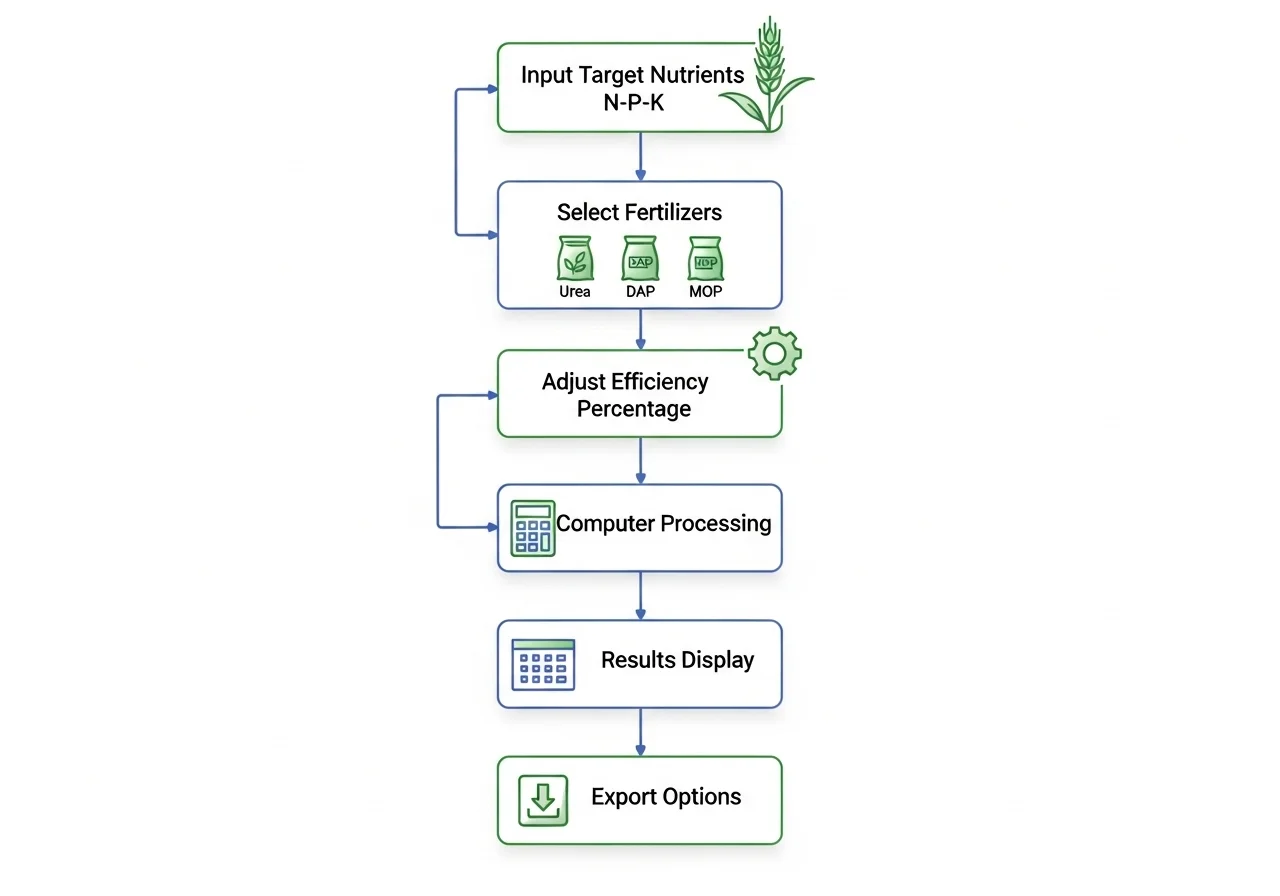
From nutrient target to final recommendation: the calculation flow behind every dose.
Kelly farms 400 acres of spring wheat outside Regina, Saskatchewan. She used to buy three bags of Urea an acre because, in her words, “that’s what Dad always did.” One season with a soil test and a proper dose calculation cut that to 2.3 bags an acre. Her yield didn’t move. Her fertilizer bill did.
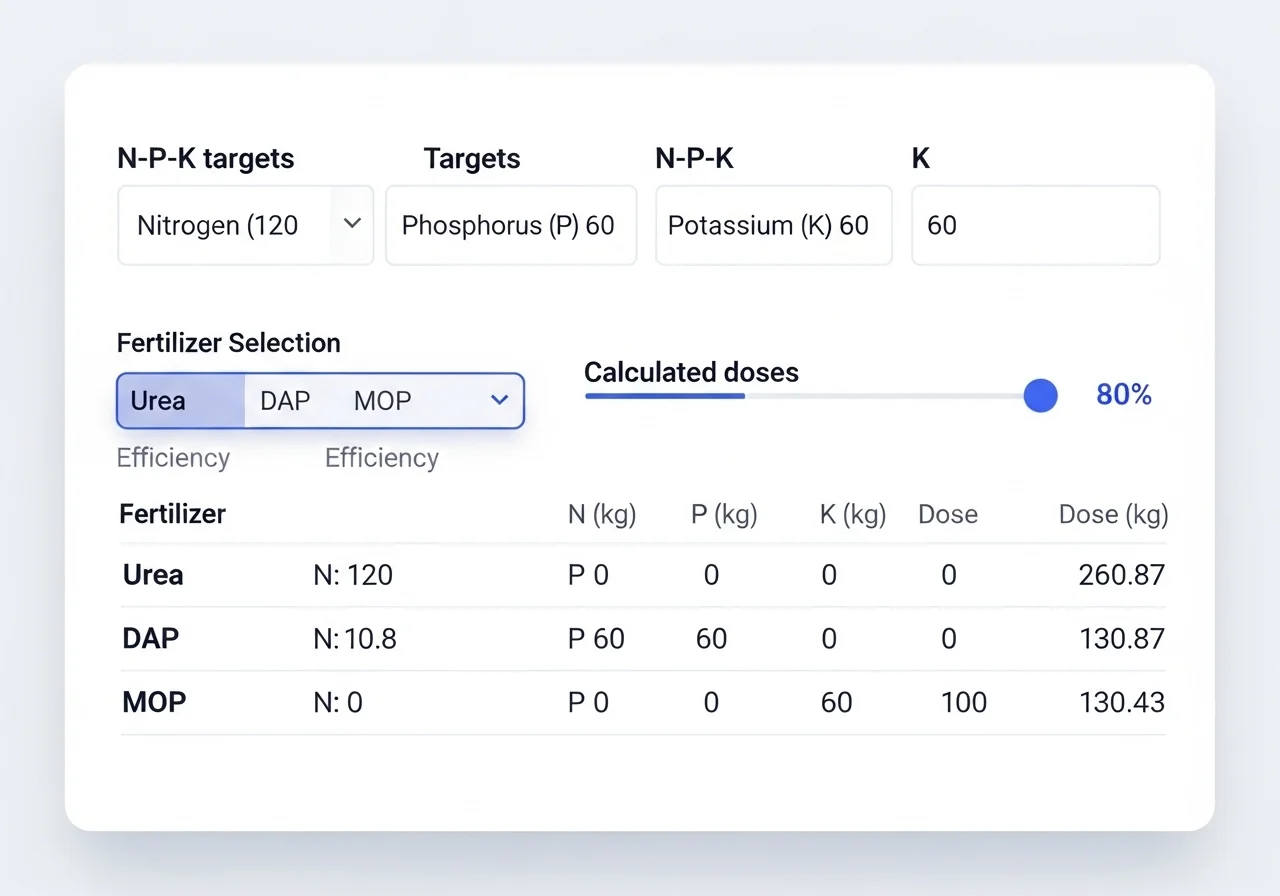
The calculator interface: enter your targets, fertilizer list and efficiency settings, then read off the exact doses above.
You’ll find the live version of this tool at the top of this page. Enter your numbers there once you’ve worked through the steps above.
How Much Fertilizer Do Different Crops Need?
These are starting ranges pulled from public extension guidance, not prescriptions. Your soil test, previous crop, and yield goal should always have the final say.
| Crop | Region | N (kg/ha) | P₂O₅ (kg/ha) | K₂O (kg/ha) |
|---|---|---|---|---|
| Corn (Maize) | Iowa / Illinois, USA | 180–220 | 70–90 | 80–100 |
| Soybeans | Midwest, USA | 0–20 | 40–60 | 80–100 |
| Winter Wheat | Kansas, USA | 90–130 | 40–60 | 30–50 |
| Cotton | Texas, USA | 100–140 | 50–70 | 60–90 |
| Canola | Saskatchewan, Canada | 100–140 | 40–60 | 30–50 |
| Spring Wheat | Manitoba, Canada | 90–120 | 30–50 | 20–40 |
| Barley | Alberta, Canada | 70–100 | 30–45 | 20–35 |
| Wheat | Western Australia | 60–90 | 30–45 | 20–40 |
| Canola | Victoria, Australia | 90–120 | 40–55 | 30–45 |
| Winter Wheat | Northern France | 140–180 | 60–80 | 50–70 |
Notice the swing within a single crop. Corn nitrogen alone spans a 40 kg/ha range depending on soil, hybrid and yield goal. That gap is exactly what a soil test and a proper calculator close.
When Should You Split Fertilizer Applications?
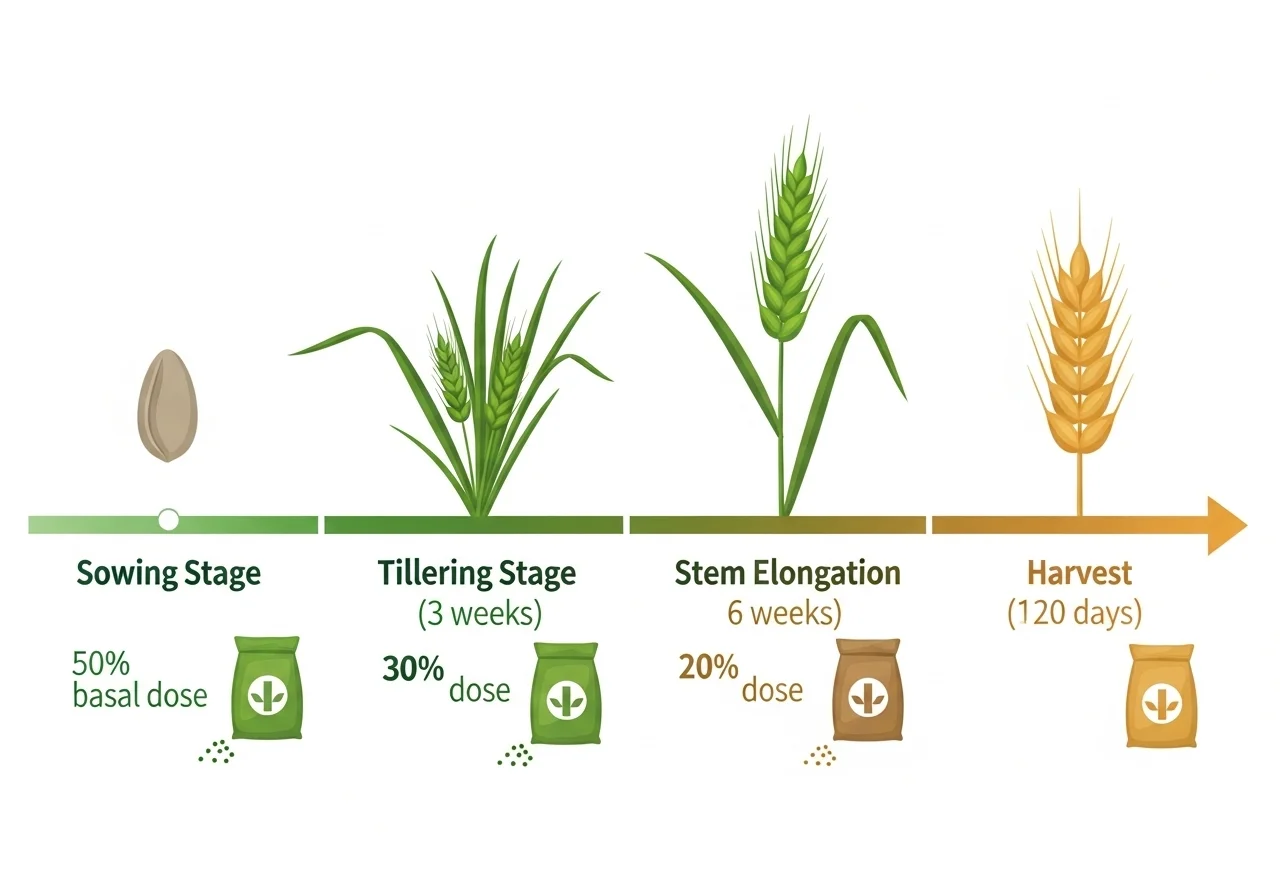
A three-stage split keeps nitrogen available when the crop actually needs it, instead of losing it to volatilization on day one.
| Split | Timing | Growth Stage | Share % | Purpose |
|---|---|---|---|---|
| Split 1 | At planting | Pre-emergence | 40% | Starter nitrogen plus full P and K for root establishment |
| Split 2 | V4–V6 (25–30 days) | Early vegetative | 35% | Support rapid canopy and stalk growth |
| Split 3 | V10–V12 (50–55 days) | Pre-tassel | 25% | Final nitrogen push before grain fill begins |
Applying every kilogram of nitrogen at sowing wastes a meaningful share to volatilization and leaching before the roots are big enough to use it. Splitting isn’t extra work so much as it’s the same total dose, delivered on the crop’s schedule instead of yours.
Common Fertilizer Dosing Mistakes That Cost Money
- Ignoring nutrient overlap. Calculating DAP purely for phosphorus, then adding a full Urea dose on top, oversupplies nitrogen by double digits. Solve for both nutrients together.
- Skipping efficiency altogether. Applying exactly 120 kg N/ha when your real-world efficiency is 65% means the crop only sees about 78 kg. Build efficiency into the math up front.
- Mixing up units. Acres versus hectares, or elemental P versus P₂O₅, throws every downstream number off. Elemental P and P₂O₅ differ by a factor of 2.29, so check which one your soil lab reports.
- Dumping the full dose at sowing. A single heavy nitrogen application can lose 40-50% to volatilization before the crop uses it. Split it.
- Not checking achieved vs. target nutrients. Always review the calculator’s output against your original targets. A gap wider than 5% means it’s time to recheck your fertilizer list or efficiency settings.
How Much Can a Fertilizer Dose Calculator Actually Save You?
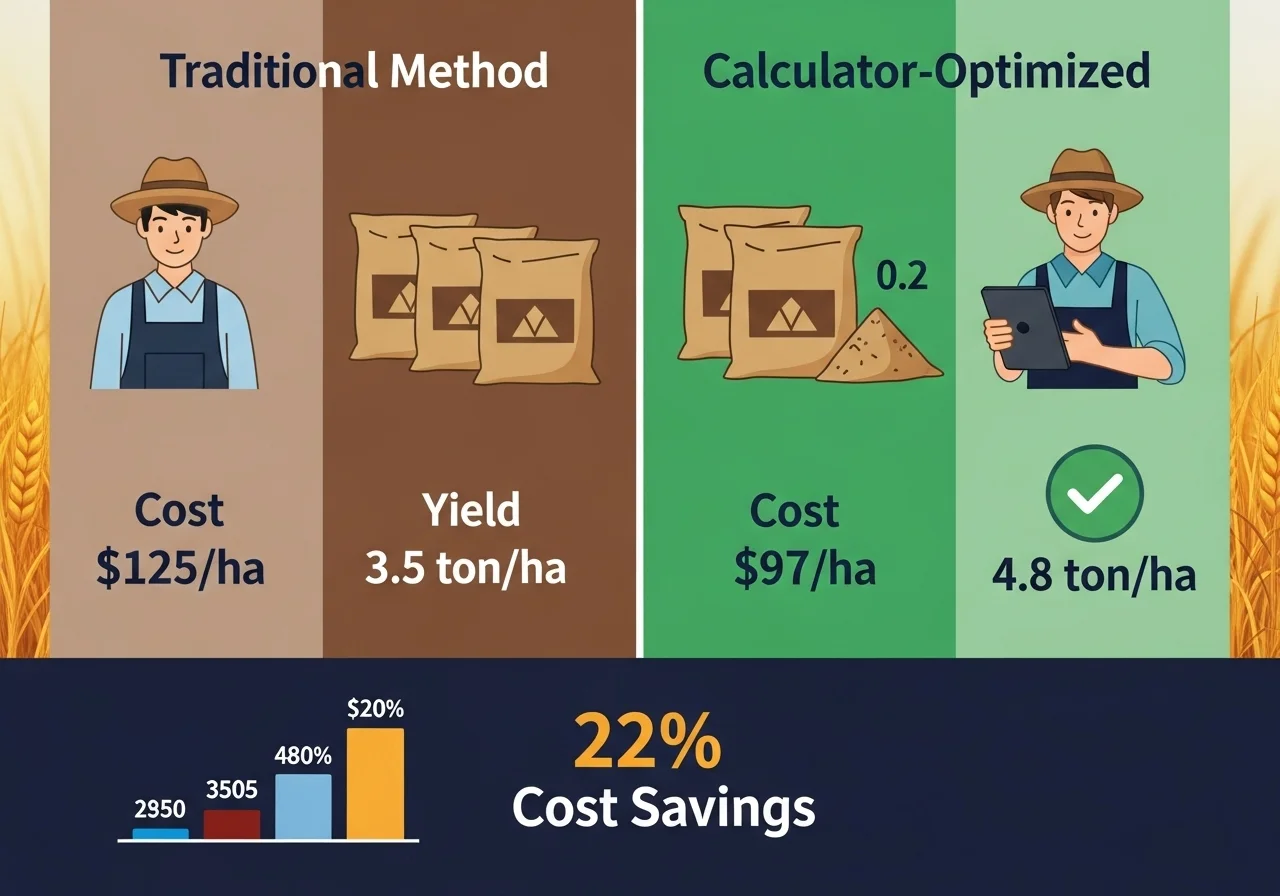
Calculated doses versus flat-rate guessing: less product, similar or better yield.
| Metric | Flat-Rate Guessing | Calculator-Based Dosing |
|---|---|---|
| Total fertilizer applied | ~520 kg/ha | ~410 kg/ha |
| Estimated cost per hectare | $145 | $112 |
| Nitrogen use efficiency achieved | ~55% | ~78% |
| Yield impact vs. baseline | Baseline | +6% to 9% |
David runs a 600-acre corn and soybean operation in central Illinois. Switching from a flat per-acre rate to calculated doses shaved roughly $28 an acre off his fertilizer bill in the first season, and his agronomist’s soil tests showed nitrogen carryover dropped too, which matters if you’re farming near a watershed.
Ready to Run Your Own Numbers?
Scroll back up to the calculator at the top of this page, enter your soil test values, and get your exact Urea, DAP and MOP doses in under two minutes.
Use the Fertilizer Dose Calculator ↑Frequently Asked Questions
A fertilizer dose calculator converts crop nutrient targets (N, P₂O₅, K₂O) into the exact quantity of Urea, DAP, MOP or other products needed per hectare or acre. It’s used to avoid over- or under-application, cut input costs, and match fertilizer supply to what a soil test actually recommends.
Use the formula: dose (kg/ha) = (nutrient requirement ÷ nutrient %) × 100. For 120 kg/ha of nitrogen using Urea at 46% N, that’s (120 ÷ 46) × 100 = 260.9 kg/ha. For multi-nutrient products like DAP, you’ll need to solve simultaneous equations, which is where a calculator saves real time.
Not every kilogram of applied fertilizer reaches the plant. Some nitrogen volatilizes, some leaches, some gets fixed in the soil. Efficiency values, typically 50-85% for nitrogen depending on method, adjust your dose upward so the crop actually receives its full target.
Elemental phosphorus and P₂O₅ (phosphate) are two different ways of reporting the same nutrient, and they differ by a factor of 2.29. If your soil lab reports elemental P, multiply by 2.29 before entering it into a P₂O₅-based calculator, or your dose will be off.
Yes. Enter the manure or compost’s N-P₂O₅-K₂O analysis as a custom fertilizer, typically around 0.5-0.3-0.5 for farmyard manure. Since organic nutrients release slower than synthetic ones, set efficiency closer to 40-60% instead of the 70-85% used for Urea or DAP.
Regional tables give you a realistic starting range, not a final answer. Soil type, previous crop, rainfall and yield goal all shift the true number. Treat regional data as your baseline, then adjust with an actual soil test before you calculate a final dose.
Most field crops benefit from splitting nitrogen into two or three applications, since it can raise nitrogen use efficiency by 15-25%. Phosphorus and potassium are usually applied in full at planting since they move less in the soil and don’t leach the way nitrogen does.
Update prices every season at minimum, and again after any major market swing. Fertilizer costs can move 10-20% between off-season and peak-demand periods, so refreshing your inputs before each purchase keeps your cost comparisons honest.
The Bottom Line
Precision fertilizer dosing isn’t a luxury reserved for large operations with agronomists on staff. Whether you’re running 40 acres in Ontario or 4,000 in Kansas, the same formula applies: know your target, know your product, adjust for what your soil actually delivers.
A fertilizer dose calculator turns that formula into a two-minute task instead of a spreadsheet headache. Start with a current soil test, run your numbers through the calculator above, and check the achieved nutrients before you place an order.
The gap between guessing and calculating usually shows up first in your bank account, and later, in a field that isn’t carrying more fertilizer than it can use.
References & Data Sources
- 1. USDA Natural Resources Conservation Service, Fertilizer Recommendations Guide (EC750)
- 2. International Plant Nutrition Institute, 4R Phosphorus Management Practices
- 3. Soil Science Society of America, Nutrient Use Efficiency Self-Study
- 4. Food and Agriculture Organization, Fertilizer Use by Crop
Last Updated: July 2026 · Next Review: January 2027 · Data reflects public agronomic guidance and university extension ranges; always confirm with a current local soil test.
Related reading: Fertilizer and Farming Calculators · About Solvebility · Why Use Our Calculators · Contact Us