

Solar Panel Degradation Calculator
Check whether your system is aging on schedule — or falling behind warranty.
Two things are happening to your solar output: what’s lost today (shading, dust, clipping) and what fades permanently every year (degradation). This guide walks you through both, using our free tool.
Somebody in your street group chat probably said it: “my solar panels are getting old, my bills are creeping back up.” Maybe that’s you right now.
Here’s the thing — that complaint could mean two completely different problems. One is temporary and fixable this weekend. The other is permanent and just needs to be tracked, not panicked over. Mixing them up is how people spend $2,000 replacing panels that were fine, or ignore a genuine warranty claim because they assumed “it’s just dust.”
This calculator (and this guide) splits the two apart cleanly. First we’ll look at what might be stealing your output right now — shading, dust, inverter clipping. Then we’ll get into what’s fading permanently, year after year, and how to check that against your actual warranty curve.
Why “Degradation” and “Today’s Loss” Are Two Different Problems
Say your system is producing 22% less than it should right now. That number alone tells you almost nothing. It could be:
- A tree that grew taller this spring and now shades panel 3 every afternoon (fixable — trim it)
- Six months of dust and pollen sitting on the glass (fixable — clean it)
- An inverter that’s undersized for your array and clipping peak output (fixable — reprogram or resize)
- Or genuine year-over-year aging that’s simply ahead of what your warranty promised (not fixable — but claimable)
The first three are what our Loss Breakdown Analyzer is built for. The fourth is what the Panel Degradation Calculator at the bottom of the same tool checks. Run both, and you’ll know exactly which bucket your 22% falls into — instead of guessing.
The 4 Things Quietly Eating Your Solar Output
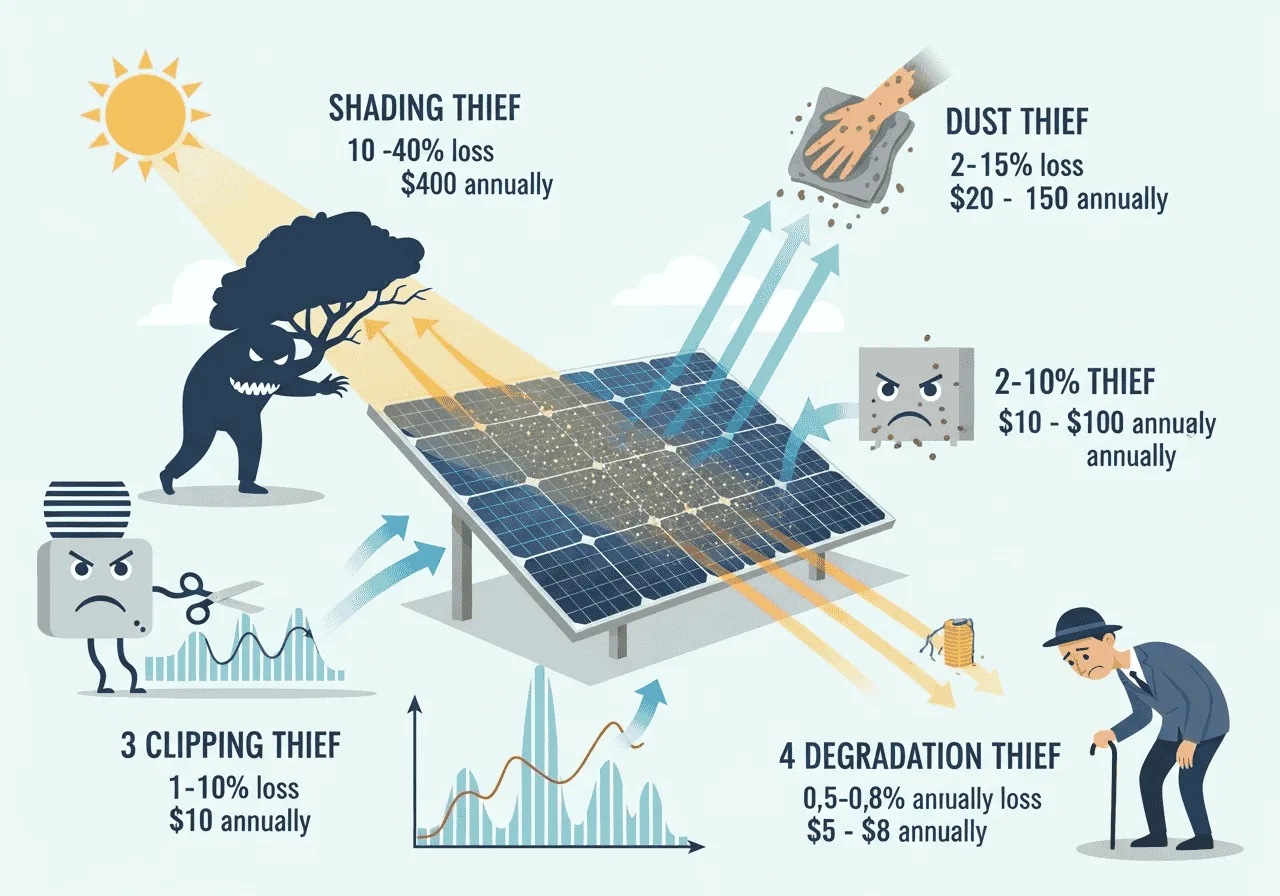
Four separate loss factors, four separate fixes — lump them together and you’ll fix the wrong thing.
Shading
Because of how panels are wired in strings, shading even one panel can drag down the whole string’s output — not just that one panel’s share. A tree, a chimney shadow, a neighbor’s new extension: any of these can quietly cost you 10–40% depending on how much of the array is affected and for how long each day.
Soiling
Dust, pollen, and bird droppings form a film that blocks light before it ever reaches the cell. This one’s regional: dry, dusty areas see faster buildup than places with regular rain washing panels clean naturally.
Inverter Clipping
If your installer sized the panel array bigger than the inverter’s capacity (common, to squeeze more production on cloudy days), the inverter caps — “clips” — output during your sunniest hours. You lose exactly the production you’d expect at noon on a clear day.
General System Losses
Wiring resistance, connector wear, and heat all take a smaller, steadier bite. None of these are dramatic on their own, but they add up — and they’re the category degradation quietly lives inside too, alongside the loss breakdown tool’s “other” bucket.
How to Use the Loss Breakdown Tool
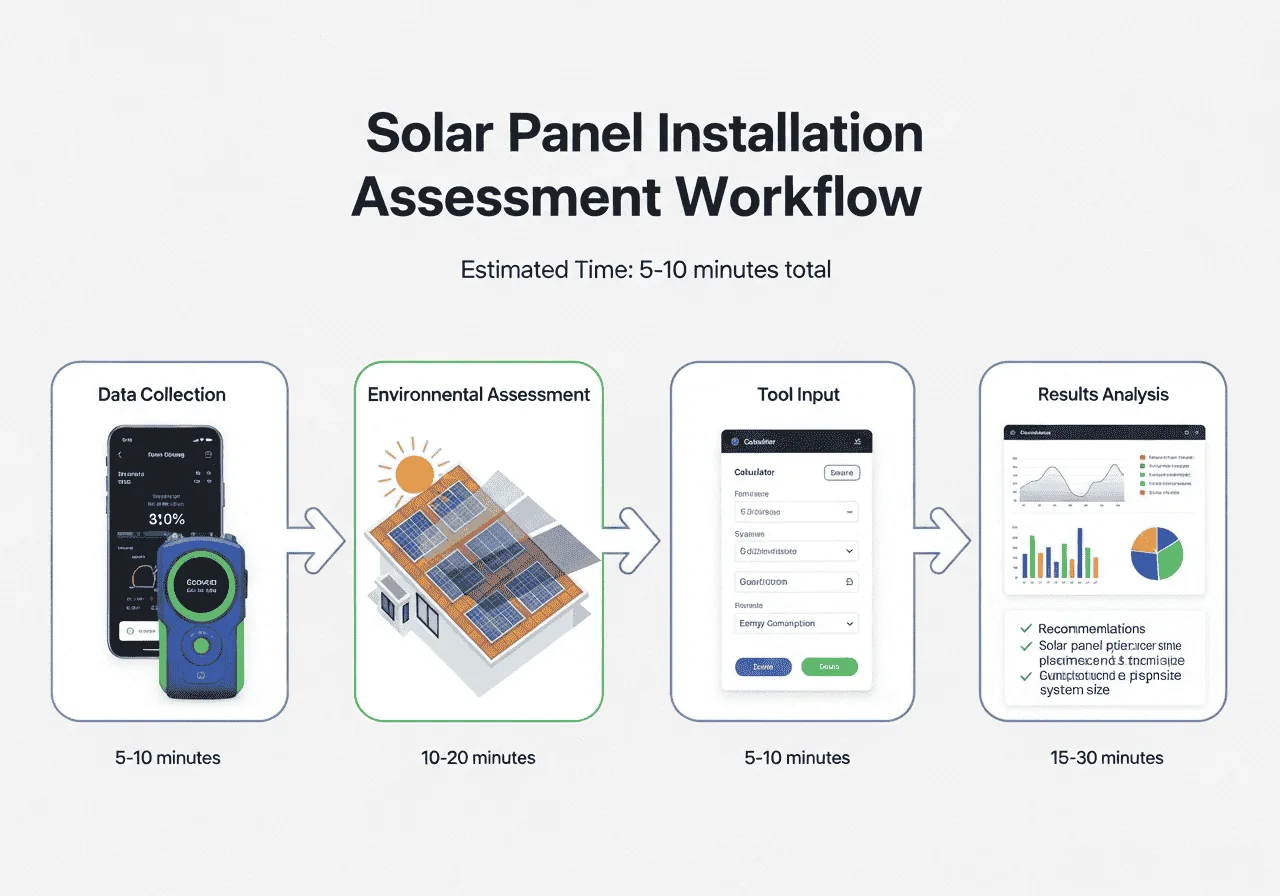
Your monitoring app (or a recent utility bill) has the two numbers you need most: expected and measured production.
What to enter
- Expected production (W): Your rated/expected AC output — check your system’s original design specs
- Measured production (W): What your monitoring app or utility bill actually shows
- Shading, soiling, clipping (%): Rough estimates are fine — walk your roof at different times of day, check when you last cleaned the panels
- System capacity (kW) and electricity price: Used to turn the loss into a dollar figure and calculate payback on fixes
What you get back
A donut chart breaking your total loss into categories, a bar comparing measured vs. expected, and a sortable table listing each loss factor with a recommended fix, estimated kWh you’d recover, rough cost, and payback period in months — so you can fix the cheapest, fastest-payback item first.
What Long-Term Degradation Actually Looks Like
Unlike shading or dust, degradation isn’t a mistake anyone made. It’s physics. The moment sunlight hits a silicon cell, a small amount of capacity is lost permanently — this happens in the first days of operation and is called Light-Induced Degradation (LID). After that first-year dip, the panel settles into a much slower, steady decline caused by UV exposure, daily heat-cool cycling, and moisture working their way into the module over years.
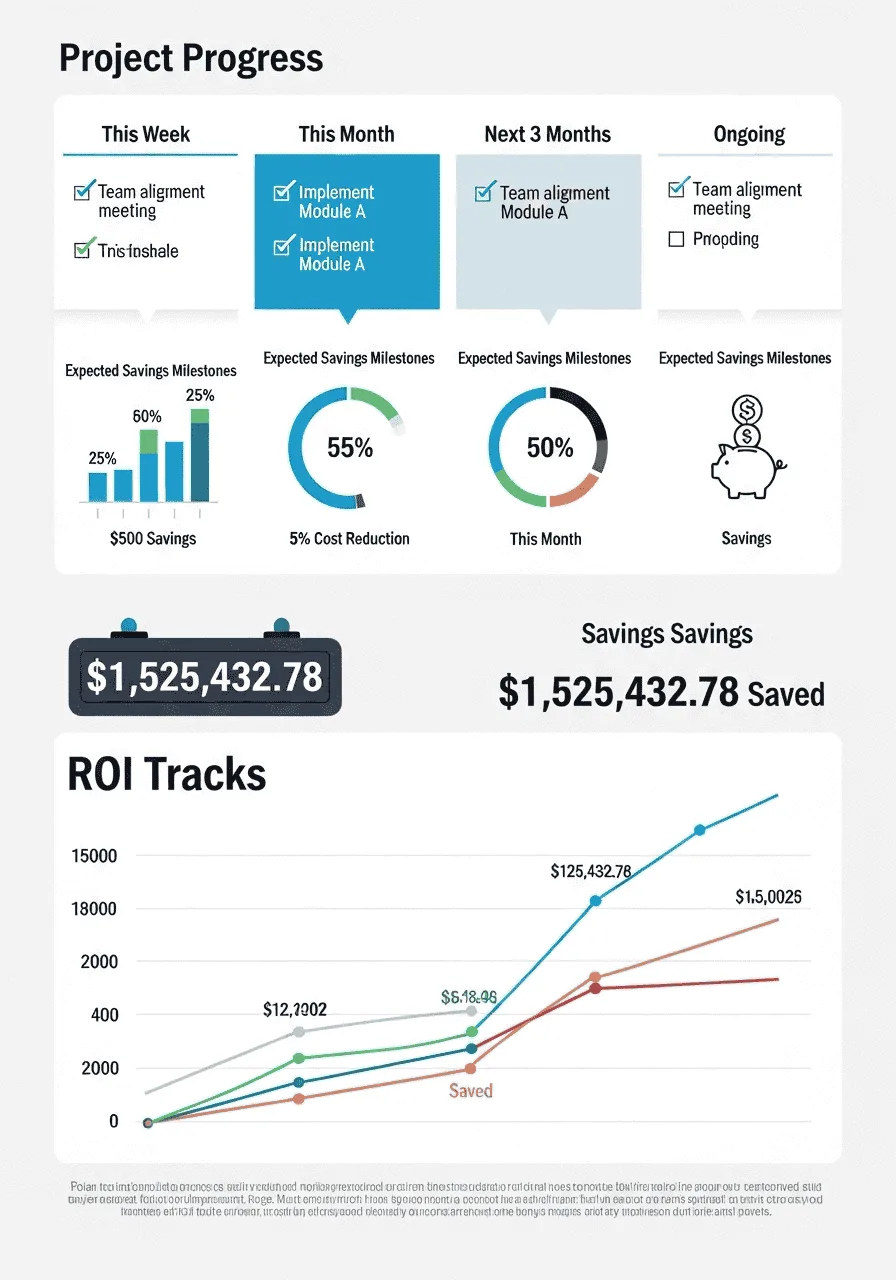
The pattern is always the same shape: a steeper dip in year one, then a long, gentle slope for the next 24+ years.
The question isn’t whether your panels are degrading — they are, and they’re supposed to. The real question is: is the rate you’re seeing normal, or is it running ahead of what the manufacturer promised? That’s exactly what the calculator’s warranty curve check answers.
Where Top Global Brands Land on the Curve
If you bought a well-known international panel, here’s roughly where its published warranty curve tends to land. Always confirm against your specific model’s datasheet — manufacturers update product lines often.
| Manufacturer | Product Line | Closest Curve |
|---|---|---|
| Jinko Solar | Tiger Neo (N-type TOPCon) | Premium |
| JA Solar | DeepBlue 4.0 (N-type) | Premium |
| LONGi Solar | Hi-MO N-series (N-type) | Premium |
| LONGi Solar | Older Hi-MO PERC lines | Standard |
| Trina Solar | Vertex N (N-type) | Premium |
| Canadian Solar | TOPHiKu6 (N-type) | Premium |
| Canadian Solar | HiKu6 (P-type PERC) | Standard |
Notice the pattern: it’s not really about the brand name, it’s about the cell technology. Every major manufacturer above sells both PERC and newer N-type panels, and the N-type lines consistently push closer to the Premium curve. If your installer didn’t specify which line you got, check your panel’s model number against the datasheet — it’s usually printed right on the frame or junction box label.
How to Run the Degradation Calculator
What to enter
- Installation date: When the system was commissioned
- Warranty curve: Standard or Premium (see above)
- Original nameplate capacity (kW): The rated STC capacity from when it was installed
- Current tested capacity (kW): From a recent clear-sky, STC-normalized test — not just a raw daily output reading, which swings with weather
What you get back
Your system’s age, the observed capacity loss in % and in kW, your average annual degradation rate, what the warranty guarantees you at this exact age, and a clear status badge: Within Warranty or Below Warranty Guarantee. A chart plots your actual point against the warranty line, so you can see at a glance whether you’re tracking above or below the curve.
Frequently Asked Questions
What’s the actual difference between the loss breakdown tool and the degradation calculator?
The loss breakdown tool is a snapshot — it compares today’s expected vs. measured output and blames shading, soiling, or clipping. The degradation calculator is a long-term check — it compares your original nameplate capacity to a properly tested current capacity, years apart, and checks that against your warranty curve. One tells you what to fix this week; the other tells you if your panels are aging normally.
Which warranty curve should I pick if I don’t know my panel model?
Start with Standard — it’s the more conservative option. Most P-type PERC panels (still common, especially in older installs) match Standard closely. If your installer mentioned “TOPCon,” “N-type,” or “HJT” panels, or your invoice lists a premium product line from Jinko, JA Solar, LONGi, Trina, or Canadian Solar, try Premium instead and compare both results.
My system shows “Below Warranty Guarantee” — what now?
First, double-check your current capacity reading came from a proper clear-sky STC test, not a cloudy-day average — that alone causes most false alarms. If the number holds up, contact your installer or the manufacturer with your installation date, original datasheet, and this test result. Most Tier-1 manufacturers process warranty claims once you can show the gap in writing.
How much of my output loss is degradation vs. something fixable?
Run the loss breakdown tool first. If shading, soiling, and clipping account for most of your gap, that’s temporary and fixable. Whatever unexplained gap remains — especially if it’s grown steadily over years, not appeared suddenly — is your best candidate for genuine degradation. Confirm it with the degradation calculator using a proper capacity test.
How often should I re-run the degradation calculator?
Once a year is plenty for most homeowners. Degradation moves slowly — checking monthly just adds noise from weather and measurement error. An annual check, ideally around the same season each year, gives you a clean trend line over time.
Do N-type (TOPCon) panels from brands like Jinko or Trina really degrade slower than older PERC panels?
Generally yes, and it’s reflected in their published warranties — N-type cells typically start with a smaller first-year dip and a slower annual rate afterward, which is exactly why they map to the Premium curve in this calculator. The gap compounds: over 25 years it can mean several extra percentage points of retained capacity compared to a standard PERC panel.
Can dust or shading make my degradation numbers look worse than they really are?
Yes, and this is the single most common mix-up. If you enter a “current tested capacity” reading taken on a dusty, partly shaded day, the degradation calculator will show a rate that’s too high. Clean the panels and pick a clear day for the test before entering numbers — otherwise you’re really measuring soiling, not aging.
Run Both Checks, Then You’ll Actually Know
Solar output drops for boring, fixable reasons far more often than it drops because of genuine aging. But genuine aging does happen, and it’s worth checking properly — not guessed at from a gut feeling about “old panels.”
Two quick checks, five minutes total: run the loss breakdown for today’s snapshot, then the degradation calculator for the long-term trend. Whichever one lights up tells you exactly what to do next — clean the panels, trim a tree, adjust the inverter, or file a warranty claim with real numbers behind it.
More Free Solar Tools on Solvebility
- Net Metering & 25-Year ROI Calculator — model your full financial payback, incentives included
- Solar Roof Area & Layout Estimator — plan panel count and placement
- PV Array String Configuration Calculator — check voltage matching before install
- Hybrid Inverter Sizing Calculator — make sure clipping isn’t baked in from day one
- Browse All Solar Calculators
- Back to Solvebility Home
References & Sources
- Jordan, D. C., & Kurtz, S. R. (2013). “Photovoltaic Degradation Rates — An Analytical Review.” Progress in Photovoltaics, 21(1), 12–29. Research conducted at the National Renewable Energy Laboratory (NREL), renamed the National Laboratory of the Rockies (NLR) in December 2025. [NLR Solar Research]
- International Electrotechnical Commission (IEC). “IEC 61215 — Terrestrial photovoltaic (PV) modules: Design qualification and type approval.”
- Manufacturer datasheets and published linear performance warranties: Jinko Solar (Tiger Neo series), JA Solar (DeepBlue 4.0), LONGi Solar (Hi-MO series), Trina Solar (Vertex N), Canadian Solar (HiKu / TOPHiKu6 series). Figures are general product-line positioning; always confirm against the datasheet for your specific model.
Last Updated: July 2026
Curve figures reflect the Standard / Premium reference model used by our calculator, cross-checked against NREL degradation research and publicly available manufacturer warranty documentation.