

Advanced Graphing Calculator: Free Online Scientific & 3D Math Solver
Plot any function in 2D or 3D, solve equations symbolically, run calculus, crunch matrices, and convert units — all inside one browser tab. No download, no account, no cost.
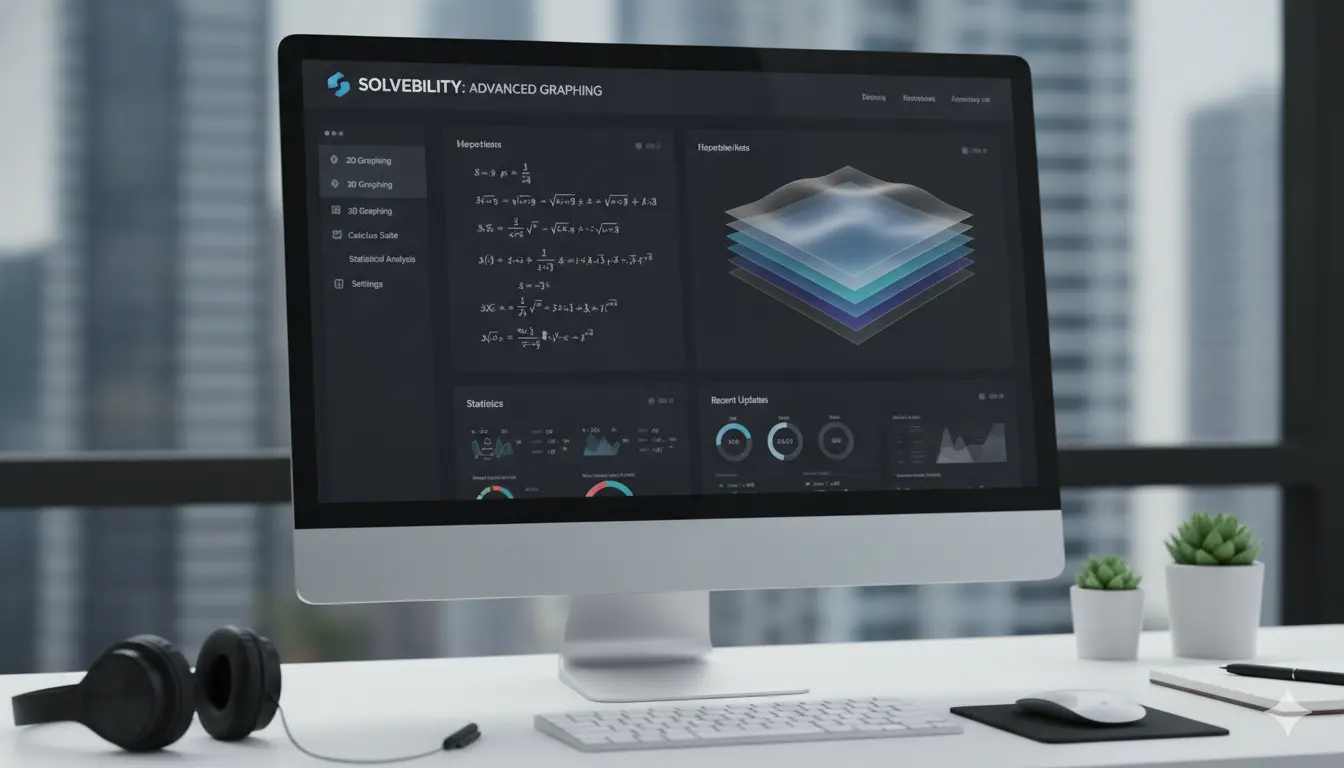
Your TI-84 cost $100. It can’t plot a 3D surface. It has no calculus module. And it definitely won’t run in your browser at 2 AM before a deadline. The advanced graphing calculator at Solvebility does all of that — free, right now.
Most students and engineers want one tool that handles the whole stack: quick arithmetic,
visualizing y = sin(x), factoring a polynomial, finding a definite integral,
running a regression. That used to mean paying for a TI-84, a Wolfram Alpha subscription, or a
MATLAB license. Now it doesn’t.
This guide walks through every module on Solvebility’s smart graphing calculator so you know exactly what it does and when to reach for it. Based on hands-on testing of all 13 modules.
What is an advanced graphing calculator?
An advanced graphing calculator is a math tool that draws functions as visual graphs, solves equations symbolically, and handles calculus, matrices, and statistics. Web-based versions like Solvebility’s run entirely in your browser with no download, supporting everything from simple algebra to 3D surface plots.
The basic version of a graphing calculator has been around since the Casio FX-7000G in 1985. That machine could plot up to 82 data points. Modern web-based tools evaluate thousands of points per millisecond using JavaScript engines like Math.js and render interactive charts via libraries like Plotly.
The gap between a scientific calculator and a graphing one is bigger than people expect. A scientific calculator gives you a number. A graphing calculator shows you the shape of a relationship. That difference matters enormously when you’re debugging an equation — seeing where two curves intersect tells you more in 2 seconds than 10 minutes of algebra.
Scientific vs graphing calculator: the real difference
Ryan, a second-year mechanical engineering student at Purdue, described it well:
“I had a scientific calculator for two years and I thought I understood trig functions.
The first time I graphed sin(x) vs cos(x) side by side I realized
I’d been memorizing patterns I never actually visualized.”
| Feature | Scientific Calculator | Graphing Calculator | Solvebility (free) |
|---|---|---|---|
| Basic arithmetic & trig | ✓ | ✓ | ✓ |
| Plot 2D functions | ✗ | ✓ | ✓ |
| 3D surface plots | ✗ | ✗ | ✓ |
| Symbolic equation solving | ✗ | Partial | ✓ |
| Calculus (derivatives, integrals) | ✗ | Partial | ✓ |
| Matrix operations | ✗ | Partial | ✓ |
| Statistics & regression | ✗ | Partial | ✓ |
| Financial calculators | ✗ | ✗ | ✓ |
| Unit converter | ✗ | ✗ | ✓ |
| Cost | $10–$25 | $90–$150 | Free |
The 13 modules, explained
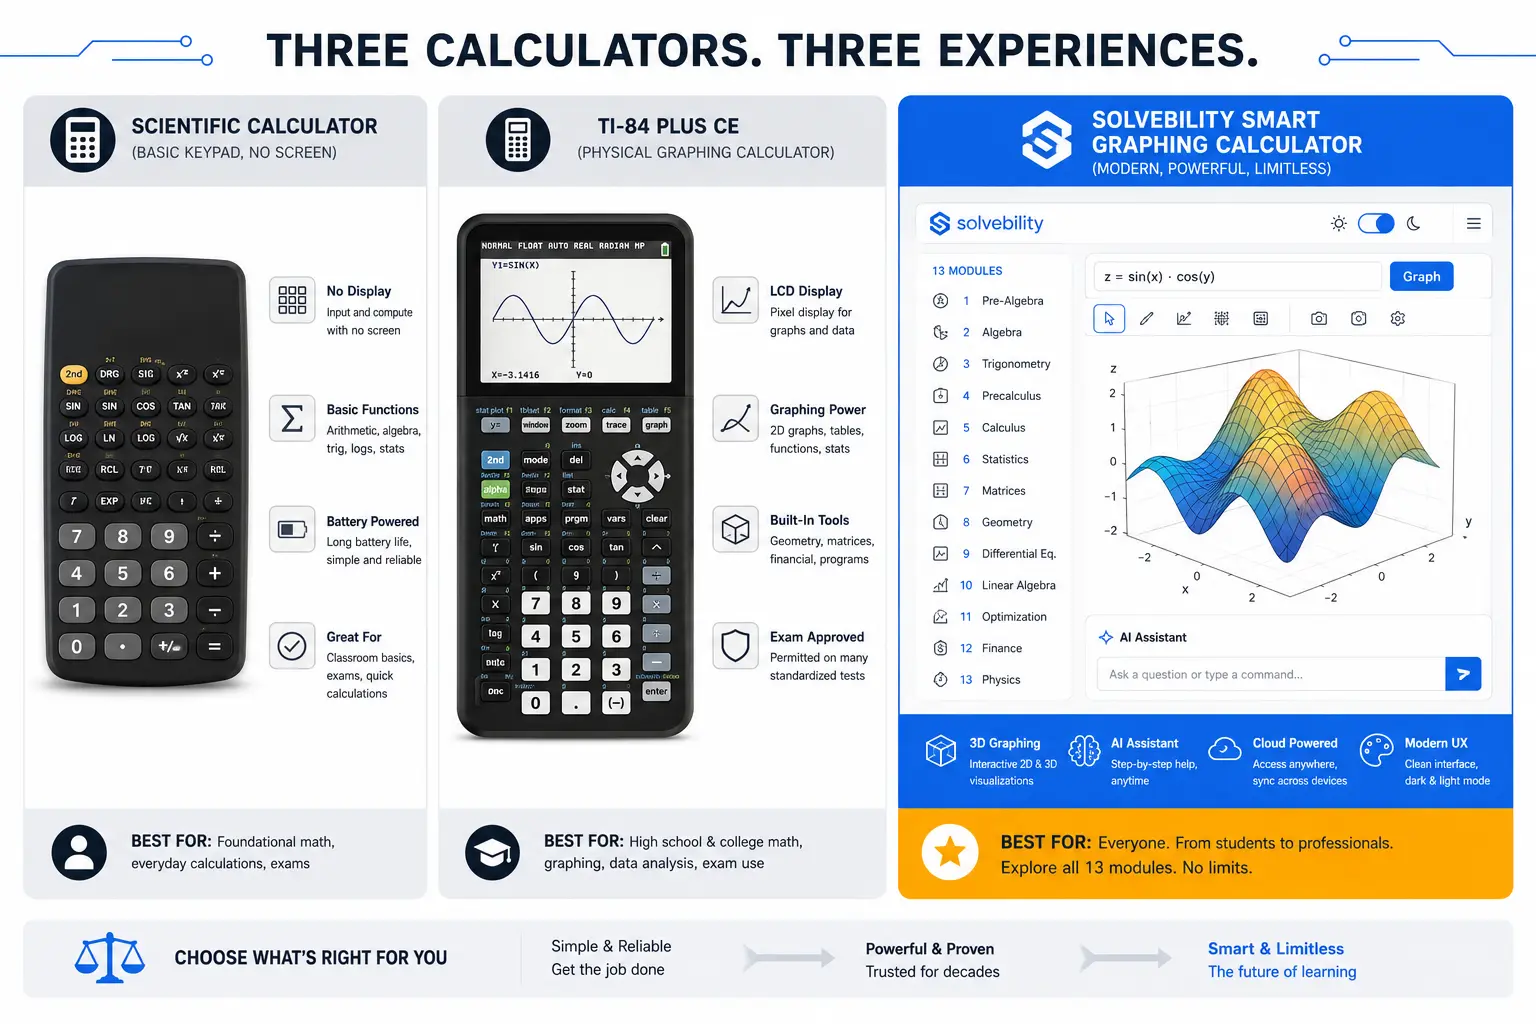
Solvebility’s smart graphing calculator has 13 distinct modules: Scientific, Equation Solver, Matrix, Statistics, 2D Graphing, Parametric Graphing, Polar Graphing, 3D Graphing, Calculus, Unit Converter, Financial Calculator, Spreadsheet, and a History/Notes panel — all accessible from the left sidebar without reloading the page.
Most calculators bolt extra features on top of a scientific base. Solvebility was built differently. Each module is its own fully formed workspace. Switching between them takes one click. Here’s what each one actually does.
Scientific Calculator
Full keypad with trig, logs, exponents, factorials. Supports degrees, radians, and gradians. Precision up to 20 decimal places.
Equation Solver
Solves any equation you can type — linear, quadratic, polynomial, cubic. Returns exact symbolic roots, not just decimals.
Matrix Calculator
Handles 2×2 through 4×4 matrices. Addition, subtraction, multiplication, determinant, inverse, transpose, rank, and eigenvalues.
Statistics
Mean, median, mode, variance, standard deviation, and linear/polynomial regression with interactive chart output.
2D Graphing
Plot multiple y=f(x) functions simultaneously, each in a different color. Zoom, pan, and set custom axis ranges.
Parametric Graphing
Define x(t) and y(t) separately. Includes an animation mode that traces the curve in real time as t increases.
Polar Graphing
Plot r(θ) functions like rose curves (sin(4θ)) and spirals. Fully configurable angle range and step count.
3D Graphing
Renders z=f(x,y) surfaces as interactive 3D plots. Surface, mesh, and contour modes with full rotation and zoom.
Calculus
Symbolic derivatives, definite and indefinite integrals, and limits. Type the function, get the symbolic result instantly.
Unit Converter
Length, temperature, pressure, energy, data storage, and more. All conversion factors are built in — no internet needed.
Financial Calculator
Compound interest, loan EMI, and ROI calculations with visual charts showing growth curves over time.
Spreadsheet
A mini spreadsheet that evaluates math formulas in each cell. Good for tabular calculations without opening Excel.
The toolbar at the top exports your current module’s output as PNG, CSV, or JSON. If you’ve just run a regression or plotted a 3D surface, hit the PNG button before closing the tab — you’ll want that graph for your report.
How to graph functions online: step-by-step
To graph a function online with Solvebility: open the 2D Graphing module from the sidebar,
type your function in y=f(x) format (e.g., x^2 - 3), set your axis range,
then click Plot. The graph renders in under a second and you can add more functions in
different colors to compare them.
Plotting a single function
- Click 2D Graph in the left sidebar navigation.
- Type your equation in the function input field — e.g.,
sin(x)orx^3 - 2*x + 1. Use*for multiplication and^for exponents. - Set X min, X max, Y min, and Y max to control the visible window. The default is
-10to10on both axes. - Click Plot. Your graph appears immediately with hover-to-inspect data points.
- Use the Zoom In, Zoom Out, and Reset buttons to explore different parts of the curve.
Comparing multiple functions
Click + Add Function to put a second equation on the same graph. Each function
gets its own color. This is useful for things like overlaying sin(x) and cos(x),
or seeing where two polynomial curves intersect.
To graph a circle (which isn’t a function), use the Parametric module instead. Set x(t) = cos(t) and y(t) = sin(t) with t from 0 to 6.2832. Hit Animate to watch it draw in real time.
Common input syntax
| Math expression | Type this | Example |
|---|---|---|
| x squared | x^2 | 3*x^2 + 5 |
| Square root | sqrt(x) | sqrt(x^2 + 4) |
| Sine / cosine | sin(x) / cos(x) | sin(2*x) + cos(x/2) |
| Natural log | log(x) | log(x + 1) |
| Log base 10 | log10(x) | log10(x^2) |
| Absolute value | abs(x) | abs(sin(x)) |
| Euler’s number e | e^x | e^(-x^2) |
| Pi | pi | sin(pi * x) |
What can the 3D graphing calculator do?
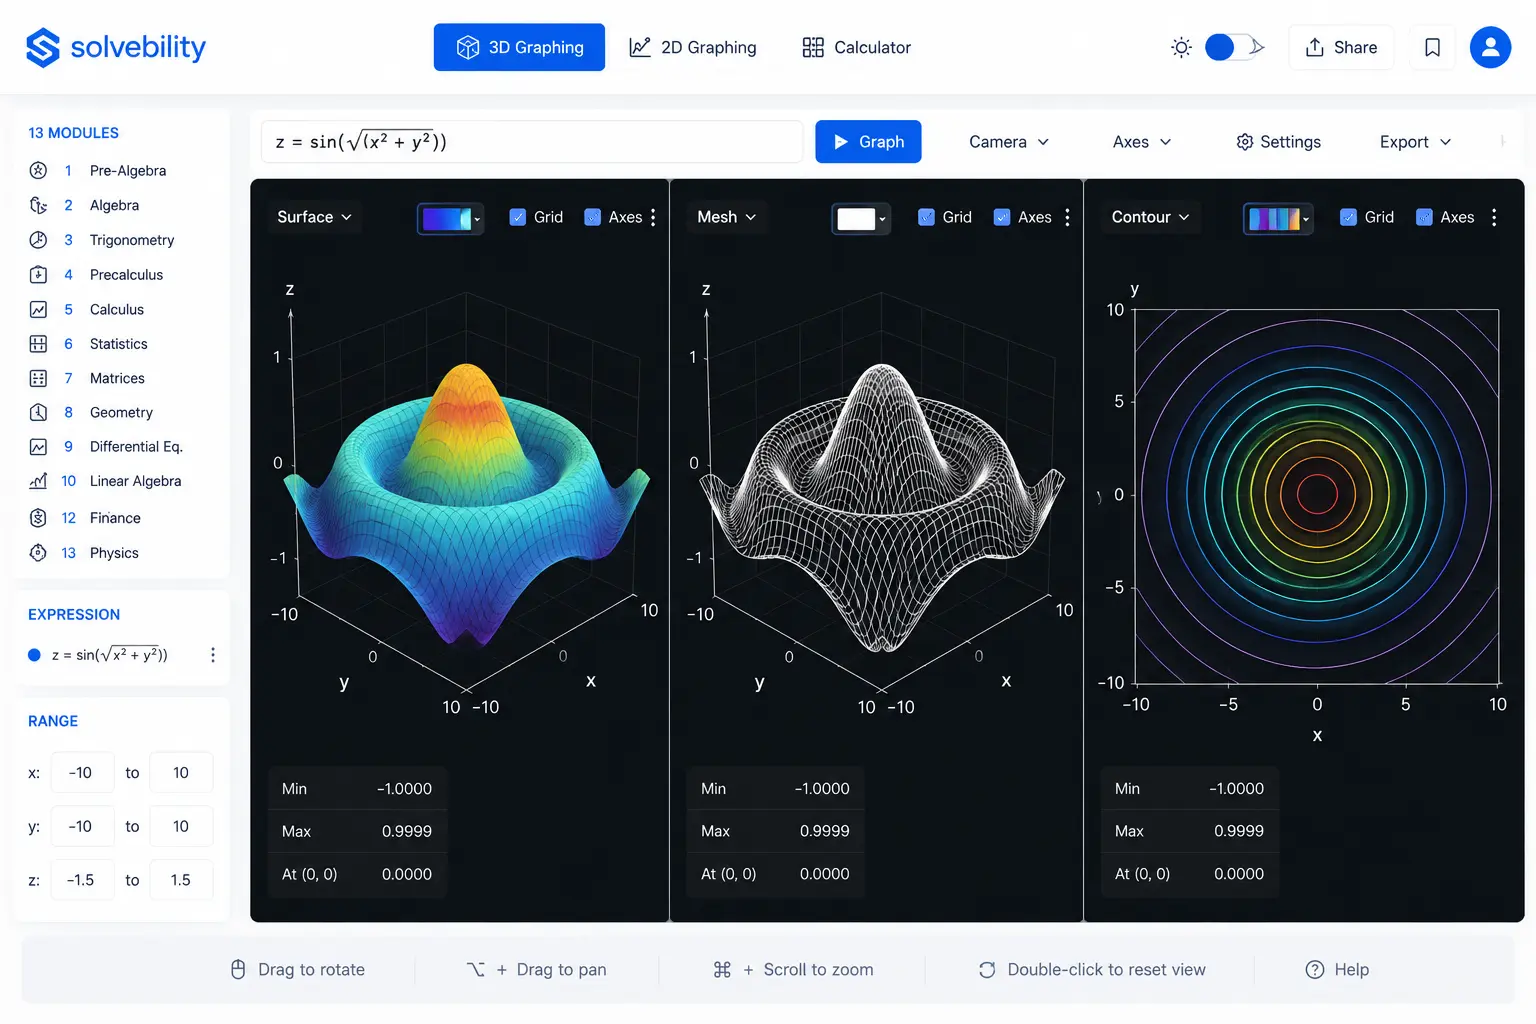
The 3D graphing module renders any z=f(x,y) function as an interactive surface you can rotate and zoom with your mouse. It supports 3 render modes: solid surface, wireframe mesh, and contour (top-down projection). This is something a physical TI-84 cannot do at all.
3D visualization is where web-based graphing calculators pull decisively ahead of physical devices. The Solvebility 3D module uses Plotly under the hood — the same library that powers professional scientific visualization dashboards.
Three render modes
Type any function of two variables in the z= field, set your x and y ranges, then choose a render mode:
- Surface: a solid 3D surface with color gradient indicating height. Easiest to read for most functions.
- Mesh: a wireframe grid showing the structure of the surface. Good for checking density and topology.
- Contour: a top-down projection like a topographic map. Useful for finding maxima, minima, and saddle points.
The classic demo function sin(sqrt(x^2 + y^2)) — a ripple pattern expanding from
the origin — is preloaded as the default. It’s a good first test because it shows the color
gradient, the rotation controls, and the zoom behavior all at once.
Solvebility vs TI-84: honest comparison
For coursework, self-study, and professional use, Solvebility’s free online graphing calculator beats the TI-84 on features, cost, and portability. The TI-84 wins only in one scenario: standardized exams (SAT, ACT, AP) that require a physical, approved device.
The TI-84 Plus CE costs around $120 at most retailers. It runs on AAA batteries, has a 320×240 pixel color screen, and was first released in 2015. Texas Instruments hasn’t substantially updated it since.
That doesn’t make it useless. If you’re sitting an AP Calculus exam in a room where phones are banned, you need it. But for everything outside that room, the picture is different.
| Feature | Solvebility (free) | TI-84 Plus CE ($120) |
|---|---|---|
| Price | $0 | ~$120 |
| 2D function graphing | ✓ Multi-function | ✓ Up to 10 functions |
| 3D surface graphing | ✓ Full interactive | ✗ |
| Parametric graphing | ✓ With animation | ✓ |
| Polar graphing | ✓ | ✓ |
| Symbolic equation solver | ✓ Exact roots | Numeric only |
| Calculus (derivatives/integrals) | ✓ Symbolic | Numeric approximation |
| Matrix operations | ✓ + Eigenvalues | ✓ Limited size |
| Statistics & regression | ✓ With charts | ✓ |
| Financial calculator | ✓ | Basic TVM only |
| Unit converter | ✓ | ✗ |
| Works offline | ✓ After first load | ✓ Always |
| Allowed in proctored exams | ✗ (browser tool) | ✓ SAT/ACT/AP approved |
| Export results (PNG/CSV/JSON) | ✓ | ✗ |
One thing worth noting: the TI-84’s equation solver returns numeric approximations.
Solvebility’s equation module uses Nerdamer, a symbolic algebra library, to return exact
solutions — so x^2 - 5x + 6 = 0 gives you x = 2, x = 3,
not x ≈ 2.0000, x ≈ 3.0000.
Calculus, matrix, and statistics: what they can actually do
Solvebility’s calculus module handles symbolic derivatives, definite and indefinite integrals, and limits. The matrix module handles up to 4×4 matrices with eigenvalue calculation. The statistics module produces mean, median, standard deviation, variance, and linear or polynomial regression with visual charts.
Calculus module: derivatives, integrals, limits
The calculus module has 3 tabs: Derivative, Integral, and Limit.
- Derivative: Type any function and get its symbolic derivative.
d/dx(x^3 + 2x) = 3x² + 2. You can also evaluate the derivative at a specific point. - Integral: Computes indefinite integrals (antiderivatives with + C) and definite integrals between two bounds. Results are exact when possible.
- Limit: Find the limit of a function as x approaches any value, including infinity. Useful for L’Hôpital’s rule verification.
This is where Solvebility genuinely goes beyond what most free tools offer. Wolfram Alpha gives symbolic answers but puts a query cap on free users. Solvebility has no query limits.
Matrix calculator: beyond basic operations
The matrix module supports matrices up to 4×4. You define Matrix A and Matrix B separately, then run operations: addition, subtraction, multiplication, determinant, inverse, transpose, rank, and — the one most calculators skip — eigenvalues.
Eigenvalue calculation matters for linear algebra students and engineers working on principal component analysis, structural vibration analysis, and quantum mechanics. Having it built into a free browser tool is genuinely useful.
Hit the Random button in the matrix module to auto-fill test values. It’s faster than typing numbers during practice sessions, and it helps you verify that your manual calculations are correct.
Statistics: regression with visual output
Paste comma-separated data into the statistics module and it instantly returns: mean, median, mode, variance, standard deviation, and a distribution chart.
The regression tool goes further. Enter X values and Y values, then choose linear or polynomial (degree 2) regression. The result includes the equation of the fit line and a chart showing the data points with the regression curve overlaid. Useful for anyone running experiments or analyzing real-world datasets.
Who actually needs a graphing calculator like this?
High school and college students in math-intensive courses are the primary users — especially those studying calculus, linear algebra, or engineering. But researchers, data analysts, and finance professionals also benefit, particularly from the regression, matrix, and financial modules that physical calculators don’t include.
Think of who reaches for an advanced graphing calculator and you’ll see the pattern quickly. High school students graphing parabolas for the first time. College students verifying integrals before an exam. An electrical engineering junior who needs eigenvalues for a circuits problem set. A finance analyst double-checking an EMI calculation.
The solar watt-hour calculator and other Solvebility tools share the same design principle: handle the full calculation in one place so you’re not stitching together results from 4 different websites.
Use cases by audience
| Audience | Most-used modules | Typical use |
|---|---|---|
| High school students | Scientific, 2D Graph, Equation Solver | Algebra, trig, pre-calc homework |
| College STEM students | Calculus, Matrix, Statistics, 3D Graph | Exam prep, lab reports, problem sets |
| Engineers | Matrix, Parametric, 3D, Unit Converter | System analysis, design verification |
| Data analysts | Statistics, Regression, Spreadsheet | Quick EDA without opening Python |
| Finance professionals | Financial, Scientific | Loan modeling, ROI comparisons |
| Educators | All modules | Live classroom demos, student-facing tools |
If you’re building a solar system, the battery sizing calculator and hybrid solar system planner are worth bookmarking alongside the graphing tool. For financial modeling, the ROI calculator and the graphing calculator’s financial module work well together for visualizing compound growth scenarios.
Frequently asked questions
x² - 5x + 6 = 0 gives x = 2, x = 3
rather than rounded decimals. You can solve for any variable, not just x.Start graphing in 30 seconds
An advanced graphing calculator used to mean spending $100 on a device you’d lose in a backpack. That’s not the situation anymore.
You now know every module Solvebility’s smart graphing calculator offers — from 2D function plotting and symbolic equation solving to 3D surfaces, calculus, and matrix eigenvalues. You know how it compares to the TI-84, and you know the one scenario (proctored exams) where the physical device still wins.
Start with the 2D graphing module and type the first function you can think of. The rest follows naturally from there.
Try the advanced graphing calculator — free
13 modules. No account. Works offline after the first load.
Open Graphing Calculator →Sources & further reading
Last updated: June 17, 2026 · Next review: December 17, 2026
- Texas Instruments. “TI-84 Plus CE Graphing Calculator.” 2024. education.ti.com
- Math.js Contributors. “Math.js — An Extensive Math Library for JavaScript.” 2025. mathjs.org
- Nerdamer Contributors. “Nerdamer — A Symbolic Math Library.” 2024. nerdamer.com
- Plotly Technologies. “Plotly JavaScript Graphing Library.” 2025. plotly.com/javascript
- College Board. “AP Calculator Policy.” 2025. apstudents.collegeboard.org
📚 Related tools on Solvebility: Battery Sizing Calculator · Hybrid Solar System Planner · Solar Watt-Hour Calculator
Written by Nouman Ahmed
Civil Engineer • Solar Energy Consultant • Software Developer
Nouman is the founder of Solvebility, with practical experience in solar PV system design, engineering calculations, and calculator development since 2011. This tool was built by Nouman and reviewed by the Solvebility engineering team to verify formulas, assumptions, and calculation accuracy before publication — and is updated whenever industry standards change.