

Irrigation & Water Management
Irrigation Water Requirement Calculator: Free FAO-56 Tool
Most growers still water on a calendar, not on what the crop actually needs. That gap costs money twice: once in wasted water and pumping fuel, and again in yield when a dry spell hits and nobody catches it in time.
An irrigation water requirement calculator closes that gap. Feed it your crop, your climate, and your soil, and it hands back the exact daily and seasonal water volume your field needs, plus how often to irrigate and roughly what it’ll cost to pump. Think of it as a farm irrigation calculator and agriculture water calculator rolled into one, built specifically around the FAO-56 standard.
In this guide, you’ll learn how the FAO-56 method behind the calculator works, how to use Solvebility’s free tool step by step, and how soil type changes your irrigation schedule more than most growers realize.
Everything below follows the FAO Irrigation and Drainage Paper No. 56 method, the same standard USDA extension offices and land-grant universities use to teach irrigation scheduling.
What Is an Irrigation Water Requirement Calculator?
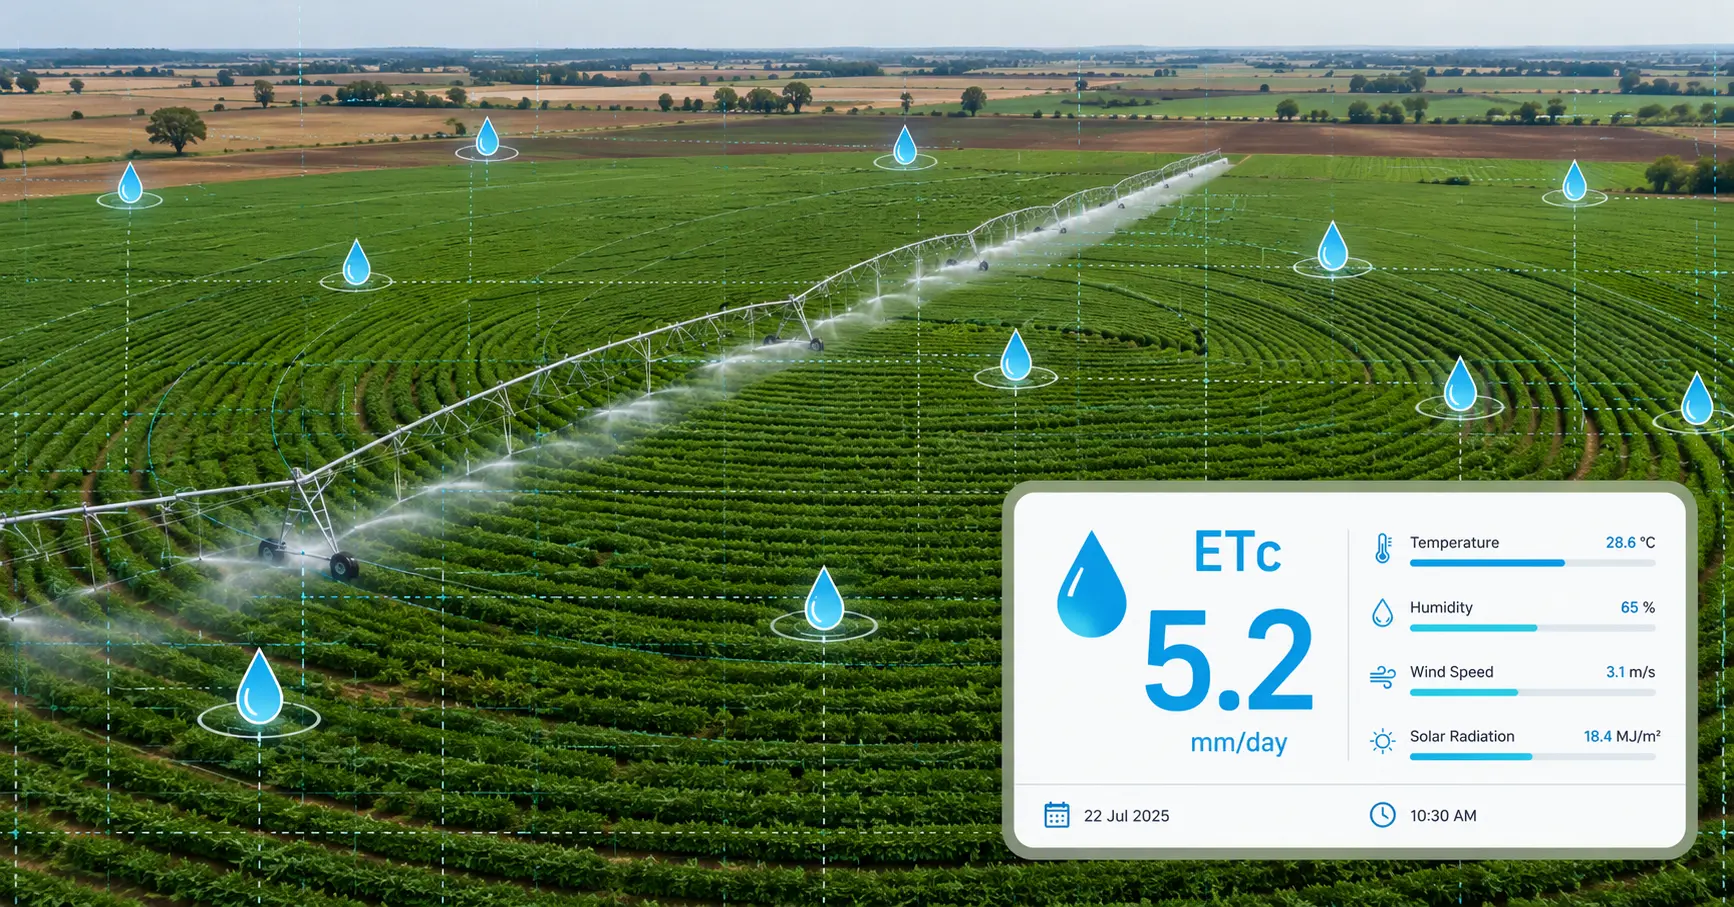
An irrigation water requirement calculator estimates how much water a crop needs over a given period by combining reference evapotranspiration (ET0), a crop coefficient (Kc), effective rainfall, and field area. It converts that need into a volume, usually cubic meters, liters, or acre-inches, so you know exactly how much to apply.
Think of it as a water budget for your field. Instead of guessing, or copying what your neighbor does, you’re working from the same numbers agronomists use: how thirsty the atmosphere is, how thirsty your specific crop is at its current growth stage, and how much of that thirst rainfall already covers.
Solvebility’s calculator adds two things most free tools skip. First, it factors in your soil type and root depth to tell you how many days you can safely go between irrigations, effectively working as an irrigation interval calculator on top of the water math. Second, it estimates pumping hours and running cost, so the output isn’t just a science number, it’s an irrigation planning calculator you can act on this week.
Run the calculator once per growth stage, not just once at planting. Water use at mid-season, when canopy cover peaks, can be 3 to 4 times higher than at emergence.
How Does the FAO-56 ETc Method Work?
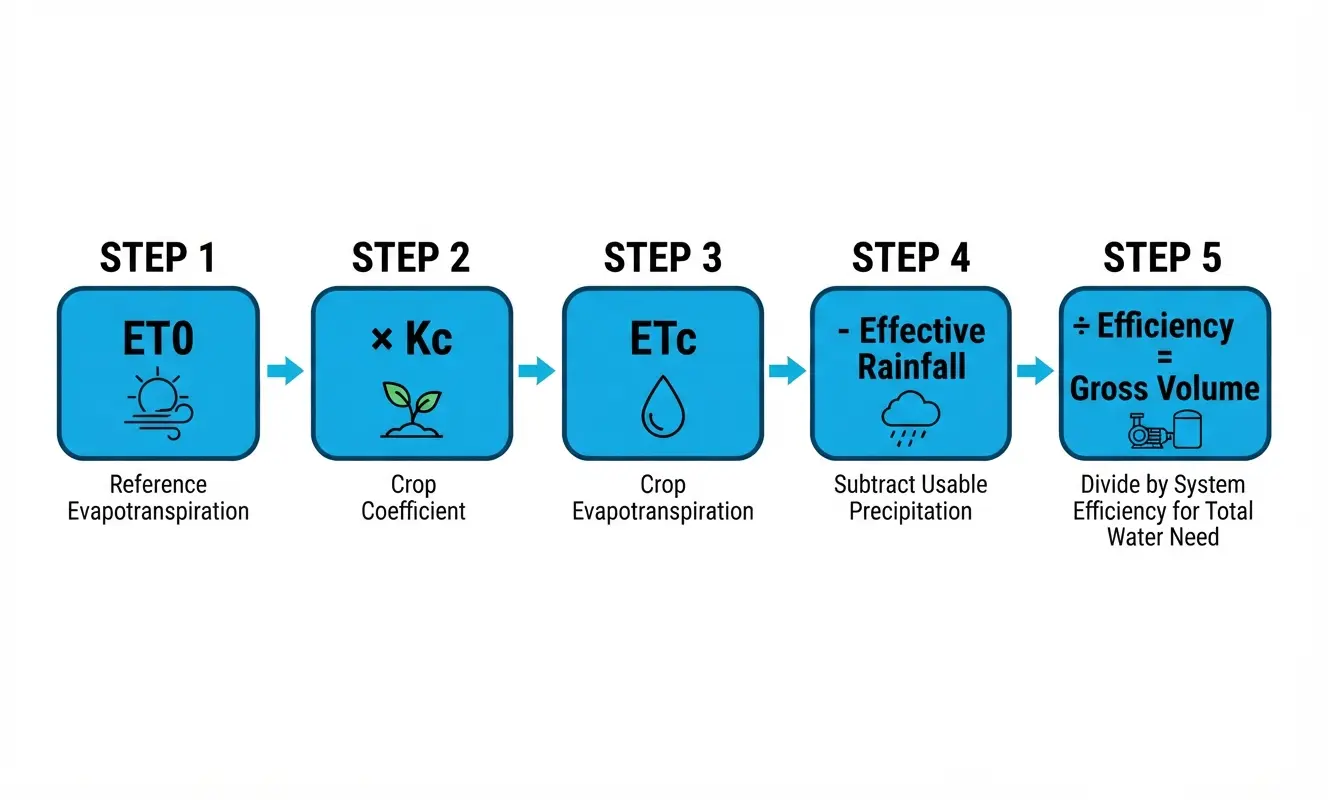
The FAO-56 method calculates crop evapotranspiration as ETc = Kc x ET0. ET0 is the water use of a reference grass surface driven purely by climate, and Kc is a crop-specific multiplier that adjusts for canopy size and growth stage. Subtracting effective rainfall from ETc gives the net irrigation requirement.
Published in 1998 by Allen, Pereira, Raes, and Smith for the Food and Agriculture Organization of the United Nations, FAO-56 is still the global reference for crop water calculations. A 2026 review in the peer-reviewed journal Water notes the method has been cited roughly 50,000 times and remains the backbone of every serious evapotranspiration calculator, from national irrigation demand calculator models down to a single-field ET0 calculator.
The three numbers that drive everything
- ET0 (reference evapotranspiration): water lost per day from a well-watered grass surface, driven by temperature, wind, humidity, and sunlight.
- Kc (crop coefficient): a multiplier, usually 0.3 to 1.2, that adjusts ET0 for your specific crop and growth stage.
- Effective rainfall: the share of rain that actually infiltrates the root zone instead of running off.
| Step | Formula | Result |
|---|---|---|
| Crop water use | ETc = Kc × ET0 | mm/day |
| Net irrigation need | NIR = ETc − Effective rainfall | mm/day |
| Net volume | Volume = NIR × Area (ha) × 10 | m³ |
| Gross volume | Gross = Net volume ÷ System efficiency | m³ |
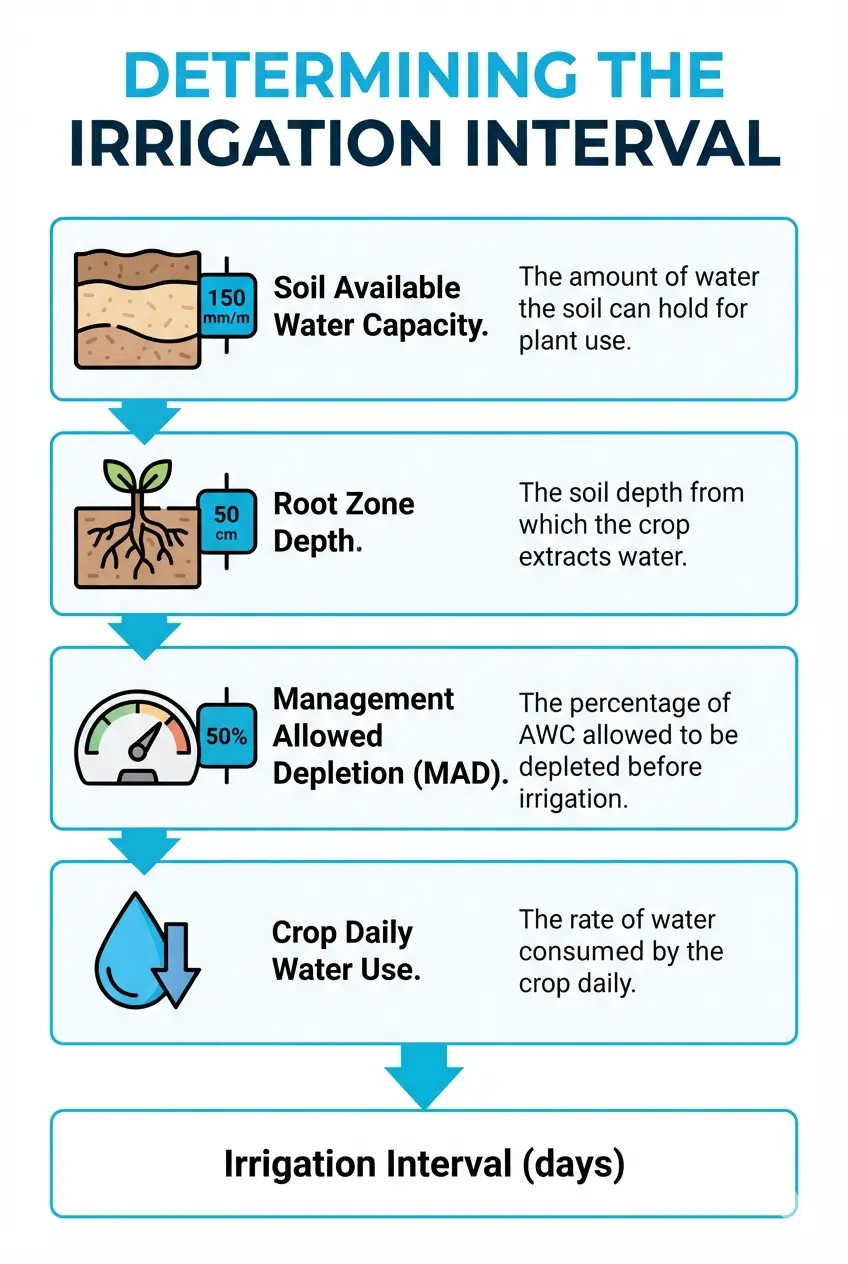
| Irrigation interval | Interval = (Soil AWC × Root depth × MAD) ÷ NIR | days |
According to the FAO’s AQUASTAT database, this same ETc methodology is applied at grid-cell resolution to estimate national and basin-level irrigation demand, not just single fields. If it holds up at that scale, it holds up for your 40 acres.
ET0 vs. ETc: What’s the Difference?
These two terms get mixed up constantly on any ET calculator, and mixing them up is where a lot of over-watering starts. ET0 is climate-only. ETc is climate plus crop.
| Factor | ET0 (reference) | ETc (crop) |
|---|---|---|
| Depends on | Weather only: sun, wind, humidity, temperature | Weather plus crop type and growth stage |
| Changes with crop? | No, same for any field in the same climate | Yes, varies with Kc across the season |
| Formula | Calculated from weather data (Penman-Monteith) | ETc = Kc × ET0 |
| Used for | The starting baseline for every crop in a region | The actual irrigation number you plan around |
Net vs. Gross Irrigation Requirement
Net irrigation is what the crop needs. Gross irrigation is what you actually have to pump, once system losses are factored back in.
| Factor | Net irrigation | Gross irrigation |
|---|---|---|
| What it represents | Water the crop’s root zone actually needs | Water you must apply at the source to deliver that net amount |
| Formula | ETc − Effective rainfall | Net irrigation ÷ System efficiency |
| Always bigger? | No, this is the smaller number | Yes, gross is always equal to or larger than net |
| Why it matters | Tells you the crop’s true demand | Tells you what to budget, pump, and pay for |
Crop Water Requirement by Growth Stage
Crop water requirement isn’t flat across a season. It follows a curve: low at planting, rising through development, peaking at mid-season when canopy cover is greatest, then tapering off as the crop matures. Mid-season water use can run 3 to 4 times higher than at emergence.
This is the part a single seasonal average completely hides. Two crops with the same total seasonal ETc can need very different weekly amounts, depending on how long each growth stage lasts.
| Growth stage | Approx. duration | Kc | Share of seasonal water use |
|---|---|---|---|
| Initial | 15 days | 0.30 | ~7% |
| Development | 30 days | 0.30 → 1.15 | ~23% |
| Mid-season | 60 days | 1.15 | ~53% |
| Late season | 15 days | 1.15 → 0.70 | ~17% |
Wheat, cotton, and most row crops follow the same general shape, an initial-development-mid-late curve, even though their exact Kc values and stage lengths differ. That’s exactly why Solvebility’s crop water requirement calculator defaults to “By growth stage” mode instead of a single flat Kc for the whole season, a flat average always underestimates mid-season demand and overestimates it at planting.
If you can only closely monitor irrigation during one part of the season, make it mid-season. That’s where more than half of total seasonal water use happens, and where a missed irrigation hurts yield the most.
How to Use the Irrigation Water Requirement Calculator, Step by Step
The calculator above takes about two minutes to fill in. Here’s what each step actually does.
- Enter field area and crop. Choose hectares, acres, or kanals, then pick your crop from the FAO-56 list. Kc and root depth load automatically, and you can still edit them.
- Add ET0 and effective rainfall. Pull ET0 from a local weather station or your state’s ag-climate network. No station nearby? Use a regional average for your growing season.
- Set soil type, root depth, and irrigation method. This is what most calculators skip, and it’s what turns a water number into an actual schedule.
- Read your results. You’ll get average ETc, net and gross irrigation volume for the season, a recommended irrigation interval, and a chart of daily water use.
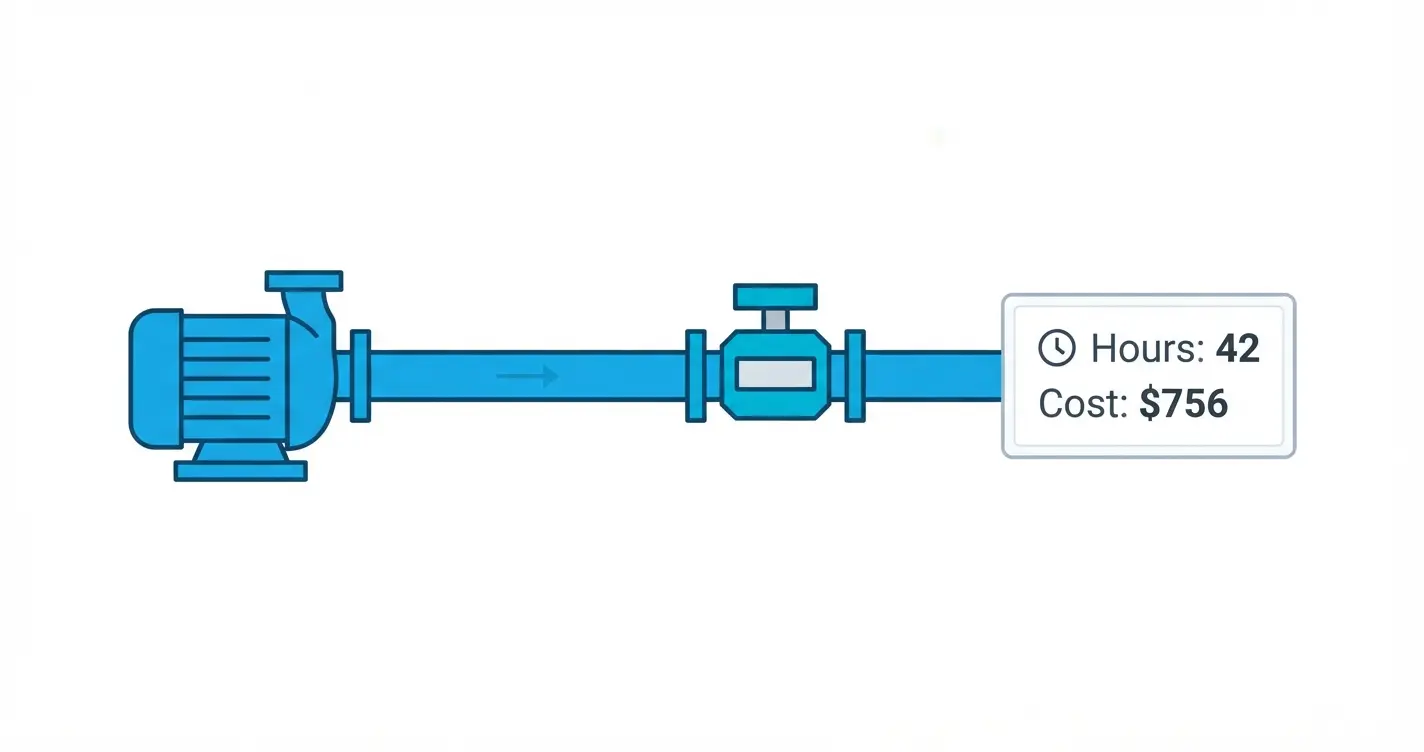
- Optional: add pump rate and cost per hour. The tool converts your gross volume into pumping hours and an estimated running cost.
If you irrigate through an unlined earthen channel, don’t skip the conveyance loss field. Seepage losses of 25 to 40 percent are common and will quietly wreck your water budget if you leave that at zero.
Need field area in a different format first? Run your dimensions through the Land Area Calculator to get acres or hectares before you plug them in here.
Why Soil Type Changes Your Irrigation Interval
Two fields can need the exact same daily ETc and still need completely different watering schedules. The difference is what’s under the crop, not the crop itself.
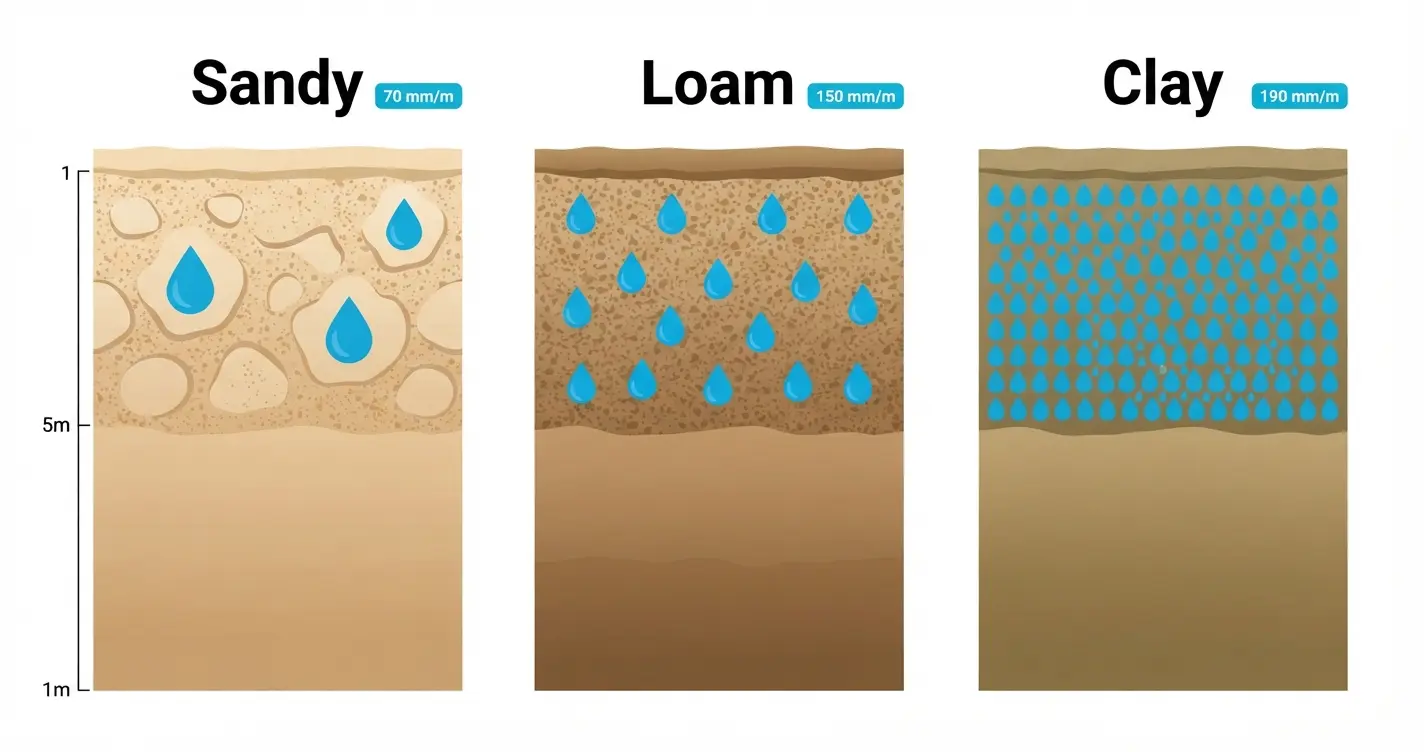
Soil holds a water “buffer” called Available Water Capacity (AWC), measured in mm of water per meter of soil depth. Sandy soil holds around 70 mm/m. Clay holds closer to 190 mm/m. Multiply AWC by root depth and by your Management Allowed Depletion (MAD, typically 50%) and you get Readily Available Water, the amount you can safely use before the crop needs re-watering.
| Soil type | AWC (mm/m) | Readily available water (mm) | Typical interval |
|---|---|---|---|
| Sandy | 70 | 35 | Every 6–7 days |
| Sandy loam | 100 | 50 | Every 9–10 days |
| Loam | 150 | 75 | Every 14–15 days |
| Clay loam | 170 | 85 | Every 16–17 days |
| Clay | 190 | 95 | Every 18–19 days |
A Washington State University Extension irrigation frequency calculator uses this same soil-root-depth logic, and it’s worth cross-checking your first few results against it while you get comfortable with the numbers.
The USDA’s Natural Resources Conservation Service adds a useful long-term angle here: every 1 percent increase in soil organic matter banks roughly 20,000 extra gallons of water per acre. Building soil health with cover crops or reduced tillage stretches your irrigation interval for free, no calculator needed.
Not sure what texture class your soil falls into? Run a sample through the Soil Texture Classifier first, it’ll tell you which AWC value to select here.
Sample Irrigation Scheduling Calendar
Once you have your growth-stage Kc values and your soil-based irrigation interval, you can turn both into an actual week-by-week calendar instead of a single seasonal average. This is what an irrigation scheduling calculator is really doing behind the scenes, it’s just running the interval formula over and over as the season moves forward.
| Week | Growth stage | Kc range | Irrigation action |
|---|---|---|---|
| 1–2 | Initial | 0.30 | Light, frequent watering to establish roots |
| 3–6 | Development | 0.30–1.15 | Interval shortens as canopy and root demand grow |
| 7–14 | Mid-season | 1.15 | Shortest, most consistent interval of the season |
| 15–17 | Late season | 1.15–0.70 | Interval lengthens, taper off before harvest |
Your own calendar will shift earlier or later depending on hemisphere and planting date, the stage-by-stage logic stays the same everywhere. Re-run the calculator at the start of each stage rather than trying to plan the whole season in one sitting, local weather rarely holds still long enough for a single calculation to stay accurate.
Water Requirement by Climate
Climate sets your ET0, and ET0 drives everything downstream. Arid regions like California’s Central Valley or inland Australia commonly see ET0 of 6 to 8 mm/day in summer, while humid temperate regions like the UK or the Pacific Northwest often run 2 to 4 mm/day. The same crop can need two to three times more irrigation water depending purely on where it’s grown.
| Climate zone | Typical ET0 | Example regions | Irrigation demand |
|---|---|---|---|
| Arid / desert | 6–9 mm/day | Southwest USA, inland Australia | High, irrigation is essential year-round |
| Semi-arid | 5–7 mm/day | Great Plains, Murray-Darling Basin, Southern Spain | High in summer, rainfall covers part of the shoulder seasons |
| Mediterranean | 4–6 mm/day | Southern Europe, coastal California | Moderate to high, dry summers drive most demand |
| Humid temperate | 2–4 mm/day | UK, Pacific Northwest, Eastern Canada | Low to moderate, rainfall covers more of the season |
| Tropical humid | 3–5 mm/day | Coastal Queensland, parts of Southeast USA | Moderate, but timing gaps between storms still need supplemental water |
None of these ranges replace an actual reading from your nearest weather station or agricultural climate network. Treat the table as a sanity check, if your local ET0 input comes back wildly outside your zone’s range, double-check the units and the source before you trust the calculator’s output.
How Much Water Do Common Crops Actually Need?
Seasonal crop water needs range from roughly 350 mm for shallow-rooted vegetables to over 1,800 mm for sugarcane, depending on climate and season length. Maize typically needs 500 to 800 mm per season, wheat 450 to 650 mm, and cotton 700 to 1,300 mm, all under FAO-56 reference conditions.
These are starting points, not fixed rules. A hot, dry climate pushes ET0 up and raises every number in this table. Run your own local ET0 through the calculator for a figure you can actually plan around.
| Crop | Season length | Root depth | Typical seasonal ETc |
|---|---|---|---|
| Maize (corn) | 120 days | 1.2 m | 500–800 mm |
| Wheat | 120 days | 1.2 m | 450–650 mm |
| Rice (flooded) | 150 days | 0.5 m | 900–1,300 mm |
| Cotton | 180 days | 1.3 m | 700–1,300 mm |
| Sugarcane | 300+ days | 1.5 m | 1,500–2,500 mm |
| Potato | 130 days | 0.5 m | 500–700 mm |
| Tomato | 140 days | 1.0 m | 400–600 mm |
| Vegetables (general) | 90 days | 0.5 m | 350–500 mm |
Planning fertilizer alongside your water budget? The Crop Nutrients Requirement Calculator uses the same crop list and pairs your irrigation plan with an NPK program in lbs/acre or kg/ha.
Where Irrigation Water Actually Gets Lost
Irrigation water is lost mainly to four things: conveyance seepage on the way to the field, deep percolation past the root zone, surface runoff, and evaporation off wet soil and leaf surfaces. Together, these losses are exactly what separates net irrigation requirement from gross irrigation requirement.
| Loss source | Typical loss | Where it happens | How to reduce it |
|---|---|---|---|
| Conveyance / seepage | 25–40% (unlined channels) | Between source and field edge | Line or pipe watercourses, shorten travel distance |
| Deep percolation | 10–25% | Below the root zone, mainly on sandy soils | Match irrigation depth to soil AWC, avoid over-applying |
| Surface runoff | 5–20% | Sloped or compacted fields, flood/furrow systems | Level fields, shorten furrow runs, reduce application rate |
| Evaporation | 5–15% | Wet soil surface and wetted foliage | Irrigate early morning or evening, mulch, switch to drip |
| Wind drift | 2–8% (sprinklers) | Airborne loss during sprinkler application | Irrigate during low-wind hours, use lower-angle nozzles |
Stack two or three of these at once, an unlined watercourse feeding a flood-irrigated, sloped field, and it’s easy to lose 40 to 50 percent of what you pump before the crop ever sees it. That gap is exactly what the gross irrigation number in the calculator is trying to protect you from.
Irrigation Efficiency Comparison
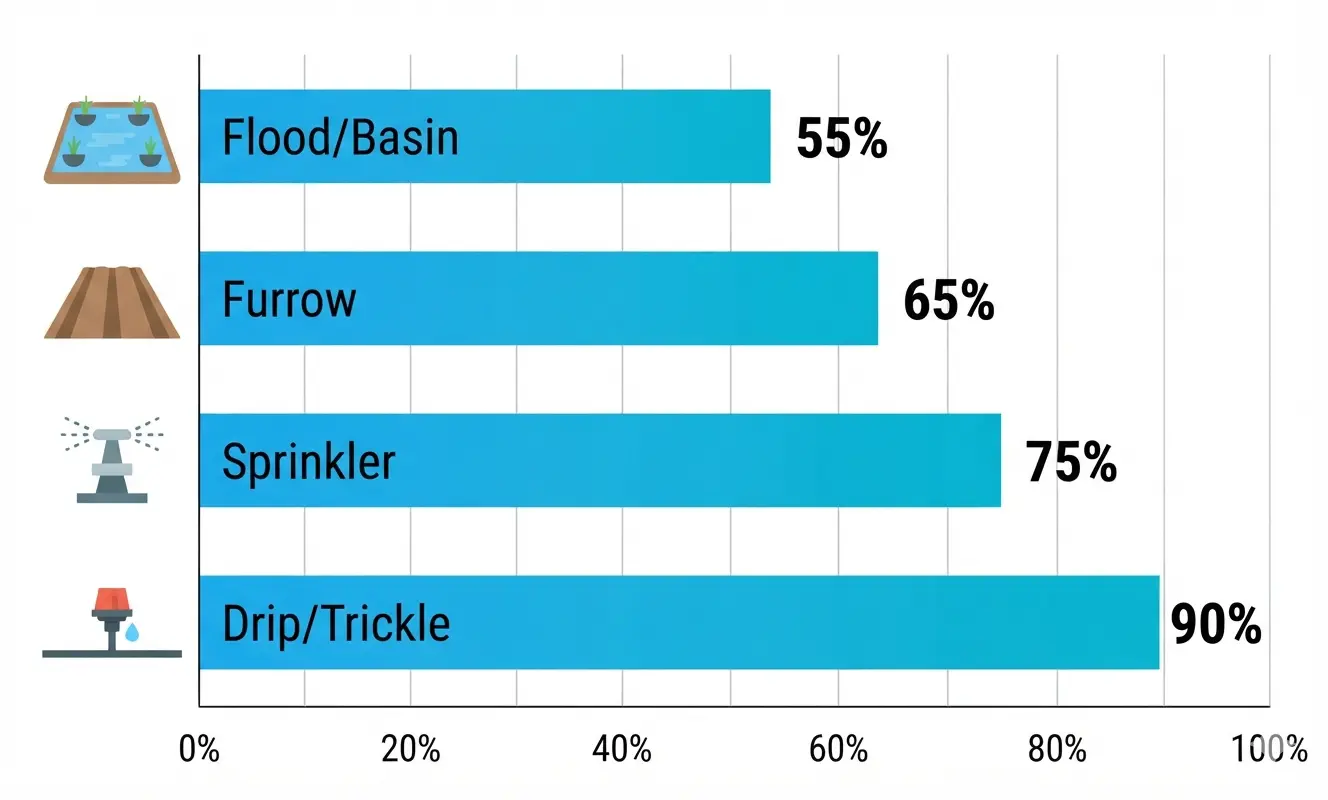
Efficiency is where most of the savings hide. The gap between what you pump and what the crop actually gets to use is often bigger than growers expect, running the numbers through an irrigation efficiency calculator usually makes that gap obvious for the first time.
| Method | Typical efficiency | Best fit for |
|---|---|---|
| Flood / basin | 50–60% | Rice, low-cost setups, flat fields |
| Furrow | 60–70% | Row crops, moderate slope |
| Sprinkler | 70–80% | Field crops, uneven terrain |
| Drip / trickle | 85–95% | Vegetables, orchards, high-value crops |
Every 10-point jump in efficiency is water you don’t have to pump, pay for, or pull from an aquifer. If you’re still on flood irrigation and considering a switch, run your numbers through the Drip Irrigation Design Calculator for a proper irrigation design, sizing lateral lines, emitter spacing, and expected pressure loss before you buy anything.
Don’t ignore conveyance loss just because it feels like someone else’s problem. Lining even 500 meters of watercourse can recover more water per season than upgrading a sprinkler head.
Correcting soil pH also plays into this. Soil outside its optimum pH range holds nutrients poorly, which pushes growers to over-water in an attempt to compensate. Check yours with the Soil Amendment Calculator before you assume the problem is water at all.
Irrigation Cost-Saving Tips
Most of these cost nothing beyond a bit of planning, and several pay for themselves within a season.
- Irrigate by growth stage, not by calendar. Running the calculator once per stage instead of once at planting alone typically trims over-irrigation by 15 to 30 percent.
- Fix conveyance losses first. Lining or piping even a short stretch of an unlined watercourse often recovers more water than any equipment upgrade downstream.
- Irrigate early morning or evening. Cuts evaporation loss and reduces wind drift on sprinkler systems.
- Match irrigation depth to soil AWC. Applying more water than the soil can hold just pushes it below the root zone as deep percolation, that’s pumping money you’ll never get back in yield.
- Build soil organic matter. Per USDA NRCS, every 1 percent increase in soil organic matter banks roughly 20,000 extra gallons of water-holding capacity per acre, stretching your irrigation interval for free.
- Upgrade high-value crops to drip first. The jump from furrow to drip on vegetables or orchards usually delivers the fastest payback of any efficiency upgrade.
- Track pumping hours, not just water volume. If your pump costs more to run than the water is worth, a smaller, more frequent irrigation schedule can lower fuel or electricity cost even when total volume stays the same.
Scroll up and run your field through the free Irrigation Water Requirement Calculator, no signup required.
Use the CalculatorFrequently Asked Questions
What is ET0?
ET0, or reference evapotranspiration, is the water lost per day from a hypothetical, well-watered grass surface, driven only by climate: temperature, wind, humidity, and solar radiation. It’s the baseline number every crop water calculation starts from.
What is ETc?
ETc, or crop evapotranspiration, is the actual water use of a specific crop, calculated as ETc = Kc x ET0. Unlike ET0, ETc changes with crop type and growth stage because the Kc value shifts throughout the season.
What is MAD?
MAD, or Management Allowed Depletion, is the percentage of the soil’s stored water that can be used up before a crop needs irrigating again without stress. A default of 50 percent works for most field crops, while sensitive vegetables often use 30 to 40 percent.
What is irrigation efficiency?
Irrigation efficiency is the share of water applied at the field that the crop’s root zone actually receives. The rest is lost to runoff, deep percolation, or evaporation before it does the plant any good. Drip systems run 85 to 95 percent efficient, while flood irrigation often sits at 50 to 60 percent.
What is effective rainfall?
Effective rainfall is the portion of total rainfall that infiltrates and stays available in the root zone instead of running off or draining below where roots can reach it. It directly reduces how much irrigation water you need to apply.
How often should crops be irrigated?
It depends on soil type and crop water use, not a fixed number of days. Sandy soil with a shallow-rooted crop might need irrigation every 6 to 7 days, while a deep-rooted crop on clay can go 18 to 19 days between waterings. Run your own numbers through an irrigation interval calculator to get your exact figure.
Which crops need the most water?
Sugarcane and other long-season, deep-rooted crops need the most total water, often 1,500 to 2,500 mm per season, simply because they’re in the ground for 300-plus days. Among common annual crops, flooded rice and cotton typically rank highest, needing 900 to 1,300 mm per season.
How much water does one acre need?
It depends entirely on crop, climate, and season length, but as a rough benchmark, one acre of maize needing 600 mm of seasonal ETc requires around 2,428,000 liters, or roughly 641,000 US gallons, of water over the growing season, before accounting for irrigation system losses.
Can rainfall replace irrigation?
In humid climates with well-distributed rainfall, effective rainfall can cover most or all of a crop’s water need during parts of the season. But rainfall rarely stays consistent enough on its own for commercial yields, most regions still need supplemental irrigation during dry spells or peak growth stages.
Which irrigation method is most efficient?
Drip, or trickle, irrigation is the most efficient method, typically delivering 85 to 95 percent of applied water directly to the root zone. Sprinkler systems run 70 to 80 percent efficient, furrow 60 to 70 percent, and flood or basin irrigation is the least efficient at 50 to 60 percent.
What is an irrigation water requirement calculator?
An irrigation water requirement calculator estimates how much water a crop needs over a given period by combining reference evapotranspiration (ET0), a crop coefficient (Kc), effective rainfall, and field area. It converts that need into a volume, usually cubic meters, liters, or acre-inches, so you know exactly how much to apply.
Why should farmers use a crop water requirement calculator instead of a fixed schedule?
A fixed watering schedule ignores how crop water use changes across the season and with weather. A calculator adjusts for growth stage, local ET0, and rainfall, which typically cuts over-irrigation by 15 to 30 percent without hurting yield, based on USDA extension data.
When is a soil-based irrigation interval the right choice?
Use a soil-based irrigation interval whenever you’re on sandy soil, growing shallow-rooted crops like onions or potatoes, or trying to avoid both drought stress and waterlogging. Deep-rooted crops on clay soils can go longer between irrigations without one.
FAO-56 calculator vs. simple ETc calculator: what’s the difference?
A simple ETc calculator multiplies one ET0 value by one Kc value for the whole season. An FAO-56 calculator splits the season into four growth stages, initial, development, mid, and late, each with its own Kc, which produces a far more accurate seasonal water total.
Is a free irrigation calculator accurate enough for commercial farming?
Yes, as long as your ET0 and rainfall inputs come from a real weather station or a reliable regional source. The FAO-56 method behind these calculators is the same one land-grant universities and USDA NRCS use in their own irrigation guides.
How much does it cost to run an irrigation water requirement calculator?
Solvebility’s irrigation water requirement calculator is free, with no signup and no limit on how many times you use it. The only real cost is your time entering field data, which takes about two minutes per field.
Get Your Irrigation Numbers Right, Once, Then Reuse Them
You now know how ET0, Kc, and effective rainfall combine into a real irrigation water requirement, and why soil type decides how often you actually need to turn the water on. That’s the whole method behind every FAO-56 irrigation calculator, including this one, and it’s the foundation of good irrigation management on any size of farm.
Start with your most water-hungry field. Enter its crop, climate, and soil, and compare the interval the calculator gives you against what you’re doing today. Most growers find at least one field that’s getting watered too often, or not often enough. That single comparison is often the fastest water budgeting win available on the whole farm.
The tool is free and stays free. Bookmark this page and rerun it every time your crop moves into a new growth stage.
Sources & Further Reading
Last Updated: | Next Review:
- FAO AQUASTAT. “Irrigation Water Requirement.”
- Water (MDPI), 2026. “Innovations in the Revised FAO56 Guidelines for Computing Crop Water Requirements.”
- USDA Natural Resources Conservation Service. “Irrigation and Water Management.”
- Washington State University Extension. “Irrigation Frequency Calculator.”
Related Solvebility tools
Written by Nouman Ahmed
Civil Engineer • Solar Energy Consultant • Software Developer
Nouman is the founder of Solvebility, with practical experience in solar PV system design, engineering calculations, and calculator development since 2011. This tool was built by Nouman and reviewed by the Solvebility engineering team to verify formulas, assumptions, and calculation accuracy before publication — and is updated whenever industry standards change.