
USDA Soil Texture Triangle: How to Classify Soil
The USDA soil texture triangle classifies soil from the percentages of sand, silt, and clay. In this guide, you’ll learn how the triangle works, how to plot a soil sample, how the 12 USDA texture classes differ, and when a laboratory test is preferable to a field estimate.
What Is Soil Texture Classification?
Soil texture is one of the most important properties of soil. It affects how well your soil drains, how much water it holds, and how easy it is to work with.
The USDA soil texture triangle is a standard soil-science tool for assigning one of 12 basic texture classes from the relative percentages of sand, silt, and clay. The three percentages are expressed for the fine-earth fraction used in USDA texture classification.
Texture is a relatively stable property of mineral soil. It strongly influences water movement, water-holding capacity, aeration, workability, and nutrient-holding behavior, but it should not be confused with soil fertility, soil structure, or engineering soil classification.
Why This Matters to You
Soil texture influences:
- Water retention and drainage rates
- Nutrient availability to plants
- Aeration and root penetration
- Workability and compaction risk
- Erosion susceptibility
Understanding your soil’s texture lets you make better decisions about land use, planting, and soil management.
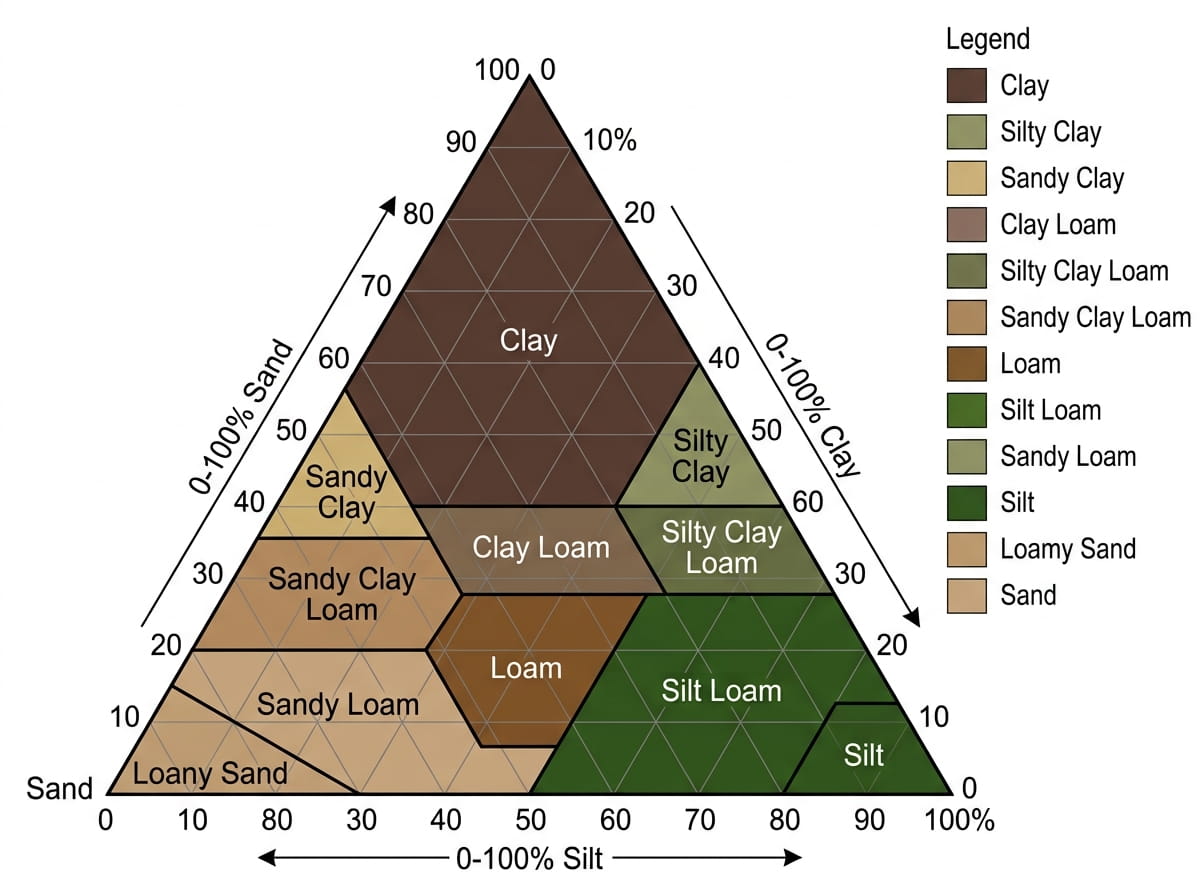
The USDA soil texture triangle is the standard tool for soil classification. Find your soil’s position by plotting sand, silt, and clay percentages.
Why Soil Texture Matters for Your Land
Soil texture directly impacts how productive your land can be. Different textures behave differently under water, weather, and plant growth.
Water Movement and Retention
Sand particles are large and irregularly shaped. Water passes through them quickly. Clay particles are microscopic and stick together tightly. Water moves through slowly but is held strongly.
This difference is critical. A sandy soil might drain in hours. A clay soil might stay waterlogged for days after rain. Both extremes create problems for most plants.
Nutrient Availability
Clay has a large surface area and, depending on its mineralogy, can contribute substantially to a soil’s cation-exchange capacity and nutrient-holding behavior. Clay content alone does not determine soil fertility; organic matter, pH, mineralogy, salinity, and nutrient availability also matter.
Sandy soils generally have less surface area for retaining water and exchangeable nutrients than finer-textured soils, so soluble nutrients can be more prone to leaching when water moves rapidly through the profile.
Silt is intermediate. It holds moderate amounts of nutrients and allows reasonable water movement.
Workability
Sandy soils are easy to dig and till. They don’t compact easily. But they’re also loose and unstable.
Clay soils are sticky when wet and hard when dry. They’re difficult to work but provide stability for structures and erosion control.
Root Penetration
Fine-textured (clay) soils can resist root growth if they’re compacted. Coarse (sandy) soils are easy to penetrate but don’t support plants well.
Medium-textured (loamy) soils allow roots to penetrate deeply while still providing support and nutrients.
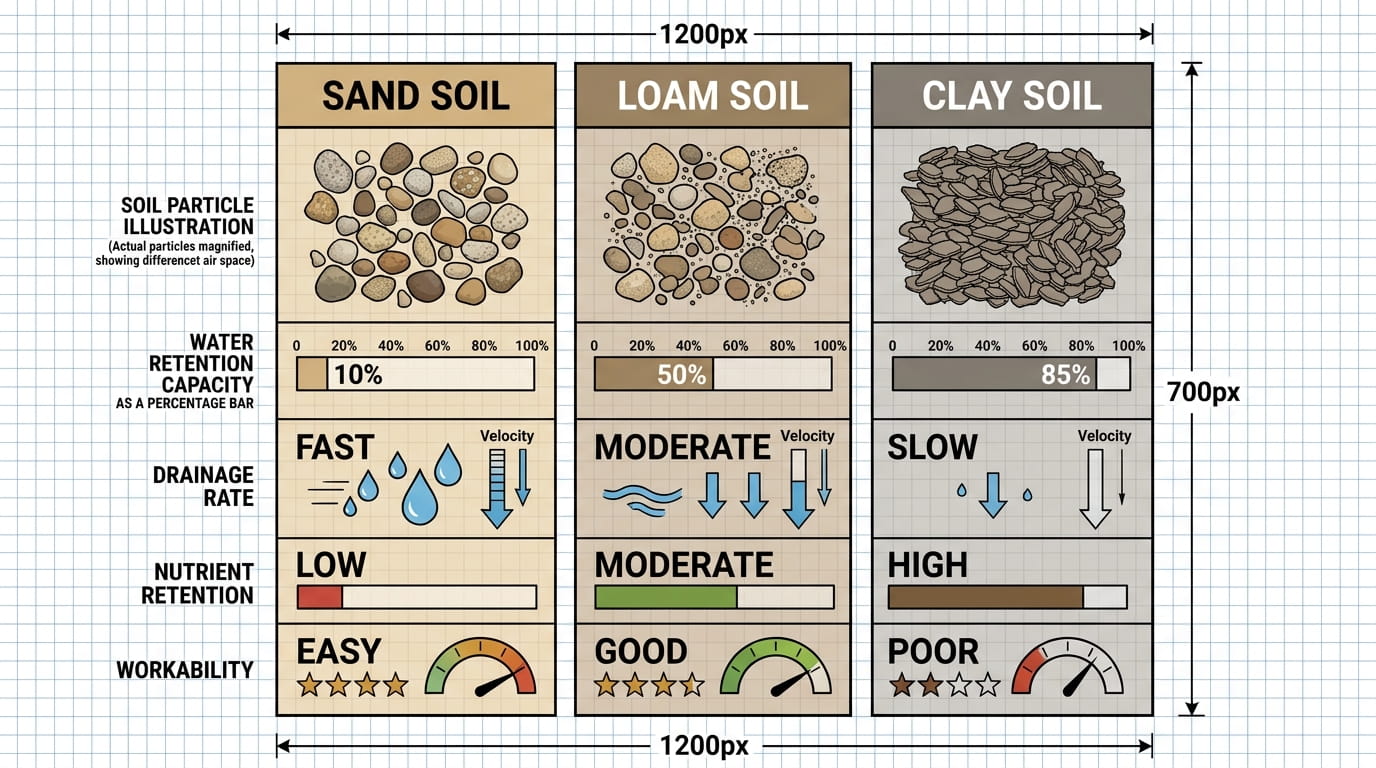
Different soil textures have dramatically different water-holding and drainage rates. Medium-textured soils such as loam often provide a useful balance of drainage and water retention for many crops and gardens.
How the USDA Soil Texture Triangle Works
The USDA soil texture triangle is deceptively simple. It’s a visual tool that converts three numbers into one clear answer: your soil’s texture class.
The Three Axes
The triangle has three axes, one for each particle size:
- Sand percentage: Runs along the bottom left
- Silt percentage: Runs along the bottom right
- Clay percentage: Runs up the left side
Each axis goes from 0% to 100%. The texture classes (like “loam,” “clay loam,” “sandy clay”) are drawn as polygons within the triangle.
How the Triangle Works (The Math Behind It)
The triangle is built on a simple constraint: sand + silt + clay = 100%.
Because the three percentages always add to 100%, you only need two of them. The third is automatically determined. This is why the triangle works as a 2D diagram instead of requiring a 3D plot.
Here’s the logic:
- Measure your soil sample. Determine the percentages of sand, silt, and clay.
- Start at the sand line on the bottom left. Go up vertically to your sand percentage.
- Find the silt percentage on the bottom right axis.
- Draw imaginary lines (or use a straight edge) from your sand percentage upward and your silt percentage upward-left.
- Where these lines intersect is your soil’s position on the triangle.
- See which colored region that point falls into. That’s your texture class.
The Boundaries Between Classes
The triangle divides into 12 regions, each representing a distinct texture class. The boundaries between regions define the ranges for each class.
These boundaries aren’t arbitrary. They’re based on real differences in soil behavior. Soils on either side of a boundary have noticeably different properties.
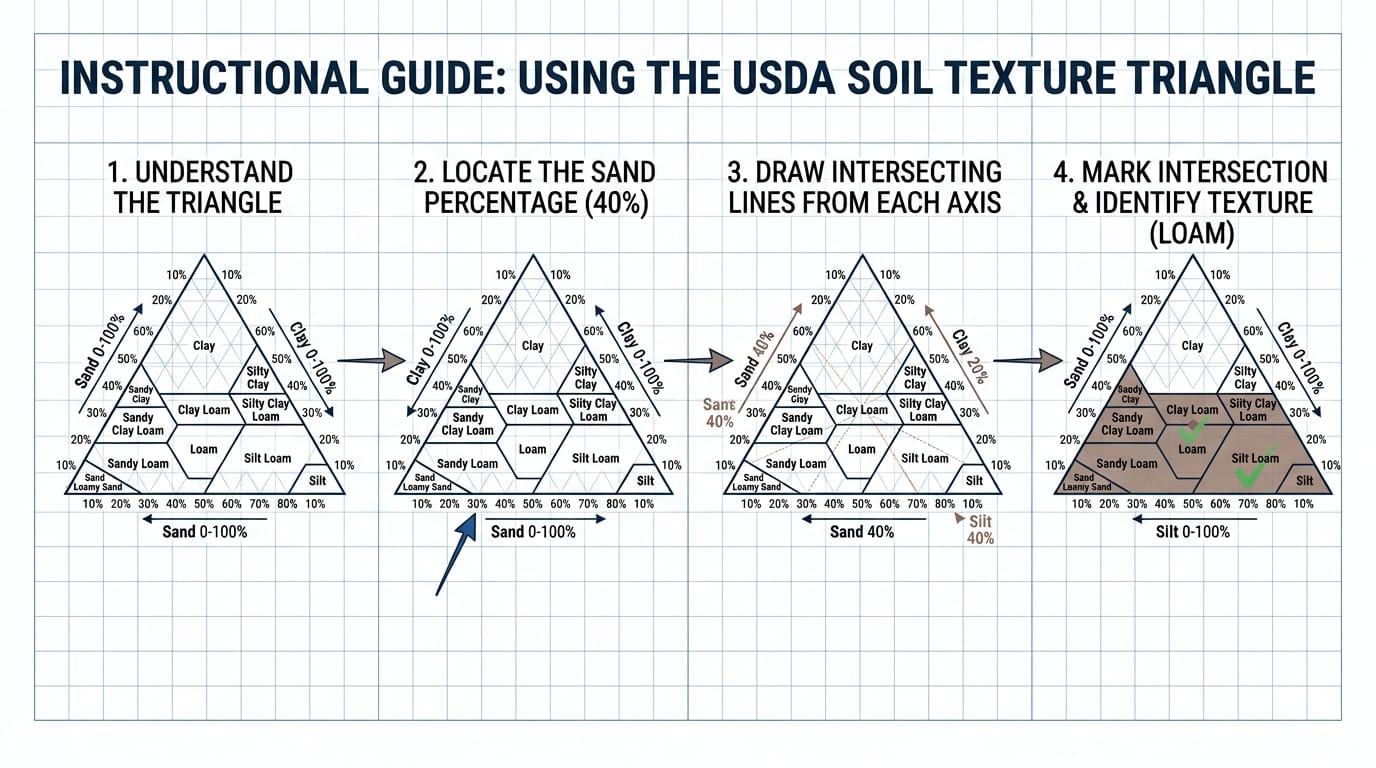
Plotting your soil on the triangle is straightforward. This example shows a soil with 40% sand, 40% silt, and 20% clay, which classifies as loam.
The Three Components: Sand, Silt, and Clay
Sand: Large, Gritty Particles
Sand particles range from 0.05 millimeters to 2 millimeters in diameter. You can see and feel individual sand grains.
Sand is composed primarily of quartz, a mineral left behind after weathering removes softer materials. It’s chemically inert and doesn’t hold water or nutrients significantly.
Characteristics of sandy soils:
- Gritty feel when rubbed between your fingers
- Rapid water drainage
- Low water-holding capacity
- Low nutrient retention
- Easy to dig and till
- Low plasticity (won’t form a ball when wet)
Soils with high sand content are ideal for drainage but poor for nutrition and water availability during dry periods.
Silt: Fine, Powdery Particles
Silt particles range from 0.002 to 0.05 millimeters. They’re too small to see with your eye but feel powdery when rubbed between your fingers when dry.
Silt is produced by weathering of primary minerals like feldspar and mica. It retains more nutrients and water than sand but less than clay.
Characteristics of silty soils:
- Powdery or floury feel when dry
- Moderate water drainage
- Moderate water-holding capacity
- Moderate nutrient retention
- Somewhat moldable when wet, but low stickiness
- Forms a weak ball that falls apart easily
Silt-dominated soils offer a middle ground between sand and clay. They’re reasonably fertile and workable but can compact if overworked.
Clay: Microscopic, Sticky Particles
Clay particles are smaller than 0.002 millimeters. They’re invisible to the human eye and composed primarily of clay minerals like montmorillonite and kaolinite.
Clay particles are plate-shaped and electrochemically active. They hold water and nutrients strongly and stick together when wet.
Characteristics of clay soils:
- Sticky when wet, hard and cracked when dry
- Slow water drainage
- High water-holding capacity
- High nutrient retention
- Poor aeration
- Forms a tight, sticky ball when wet
- Can develop large cracks when drying
Clay-rich soils often have greater water- and nutrient-holding capacity, but that does not automatically make them fertile. When wet, fine-textured soils can be difficult to work and may be more susceptible to compaction.
| Particle Type | Size Range (mm) | Water Retention | Nutrient Retention | Workability | Drainage |
|---|---|---|---|---|---|
| Sand | 0.05–2.0 | Generally low | Generally low | Generally easy to work | Rapid |
| Silt | 0.002–0.05 | Moderate | Moderate | Often workable | Moderate |
| Clay | <0.002 | Generally high | Generally high | Generally lower workability when wet | Very slow |
How to Use the USDA Triangle to Classify Your Soil
Step 1: Get Your Particle Size Analysis
You need three numbers: percentage of sand, silt, and clay. These add to 100%.
You can obtain these through:
- Lab analysis: Send soil to a testing lab (most accurate, $15–50 per sample)
- Jar method (sedimentation): Do it yourself at home (free, less accurate)
- Feel method: Estimate by texture when wet (quick, requires experience)
For serious land management or agriculture, lab analysis is worth the cost. For general knowledge, the jar method works fine.
Step 2: Locate Your Percentages on the Triangle
The USDA triangle has three axes labeled with percentages from 0 to 100.
Let’s work through an example:
- Your soil sample: 40% sand, 40% silt, 20% clay
- Start at the left axis (clay). Find 20%.
- Find 40% on the bottom-left axis (sand).
- Find 40% on the bottom-right axis (silt).
Step 3: Plot Your Point
Imagine three lines:
- A line parallel to the left side of the triangle, passing through your sand percentage
- A line parallel to the right side, passing through your silt percentage
- A line parallel to the bottom, passing through your clay percentage
These three lines intersect at a single point. That’s your soil’s position on the triangle.
In practice: Use a straightedge or transparent ruler. Place it across the sand percentage and the silt percentage, angled to intersect both. That intersection point is your answer.
Step 4: Identify Your Texture Class
The triangle is divided into 12 colored regions, each labeled with a texture class name (loam, clay loam, sandy loam, etc.).
Whichever region your point falls into is your soil’s texture class.
Using Our Soil Texture Calculator
Plotting by hand can be tedious, especially for many samples. Our Soil Texture Classifier calculator does this instantly. Enter your percentages, and it returns your texture class, hydration properties, and management recommendations.
Try the Soil Texture CalculatorCommon Soil Texture Types and What They Mean
The 12 USDA Soil Texture Classes
The USDA texture triangle contains 12 basic classes: sand, loamy sand, sandy loam, loam, silt loam, silt, sandy clay loam, clay loam, silty clay loam, sandy clay, silty clay, and clay. These classes are defined by the boundaries of the triangle, not by independent rectangular minimum and maximum ranges for sand, silt, and clay. That is why the triangle itself should be used for an exact classification.
| Texture Class | General Character | Typical Behavior |
|---|---|---|
| Sand | Very coarse | Very rapid drainage; low water-holding capacity |
| Loamy Sand | Coarse | Rapid drainage with somewhat greater retention than sand |
| Sandy Loam | Moderately coarse | Good drainage; moderate water retention |
| Loam | Medium-textured | Relatively balanced water retention and drainage |
| Silt Loam | Medium-textured | Good moisture retention; may be susceptible to crusting or erosion |
| Silt | Fine/silty | High moisture retention; can be susceptible to erosion |
| Sandy Clay Loam | Moderately fine | More water retention than sandy loam, with substantial sand influence |
| Clay Loam | Fine | Higher water retention and slower drainage than loam |
| Silty Clay Loam | Fine | High moisture retention; slower drainage |
| Sandy Clay | Very fine | High clay influence with more rapid movement than other clay textures |
| Silty Clay | Very fine | High moisture retention and slow drainage |
| Clay | Very fine | Very high water retention; slow movement of water and air can be difficult |
Important: A soil does not become a texture class simply because each percentage falls inside a three-column range. The three percentages must total 100%, and the point must fall within the corresponding USDA triangle region.
What Does Loam Mean?
Loam is a USDA texture class near the center of the texture triangle. It represents a relatively balanced combination of sand, silt, and clay; it does not require equal percentages of the three separates.
Because medium-textured soils such as loam, sandy loam, and silt loam often provide a useful balance of water retention, drainage, and workability, they are commonly favorable for plant growth. Actual performance still depends on soil structure, organic matter, climate, compaction, and management.
Coarse vs. Fine Soil Textures
Coarse textures, such as sand and loamy sand, generally have larger pores and faster water movement. They can require more frequent irrigation and nutrient management because water and soluble nutrients can move through them quickly.
Fine textures, such as clay and silty clay, generally have smaller pores, greater water-holding capacity, and slower movement of water and air. When wet, they can be difficult to work and more susceptible to compaction.
USDA Soil Texture vs. Engineering Soil Classification
The USDA texture triangle is primarily a soil-science classification based on the relative proportions of sand, silt, and clay. It should not be used as a substitute for a geotechnical soil classification when designing foundations, evaluating bearing capacity, analyzing settlement, or making other engineering decisions.
Engineering projects commonly use systems such as the Unified Soil Classification System (USCS), which classifies soils for engineering purposes using criteria that differ from the USDA texture system. A USDA texture class can provide useful background information, but it is not a foundation-design result.
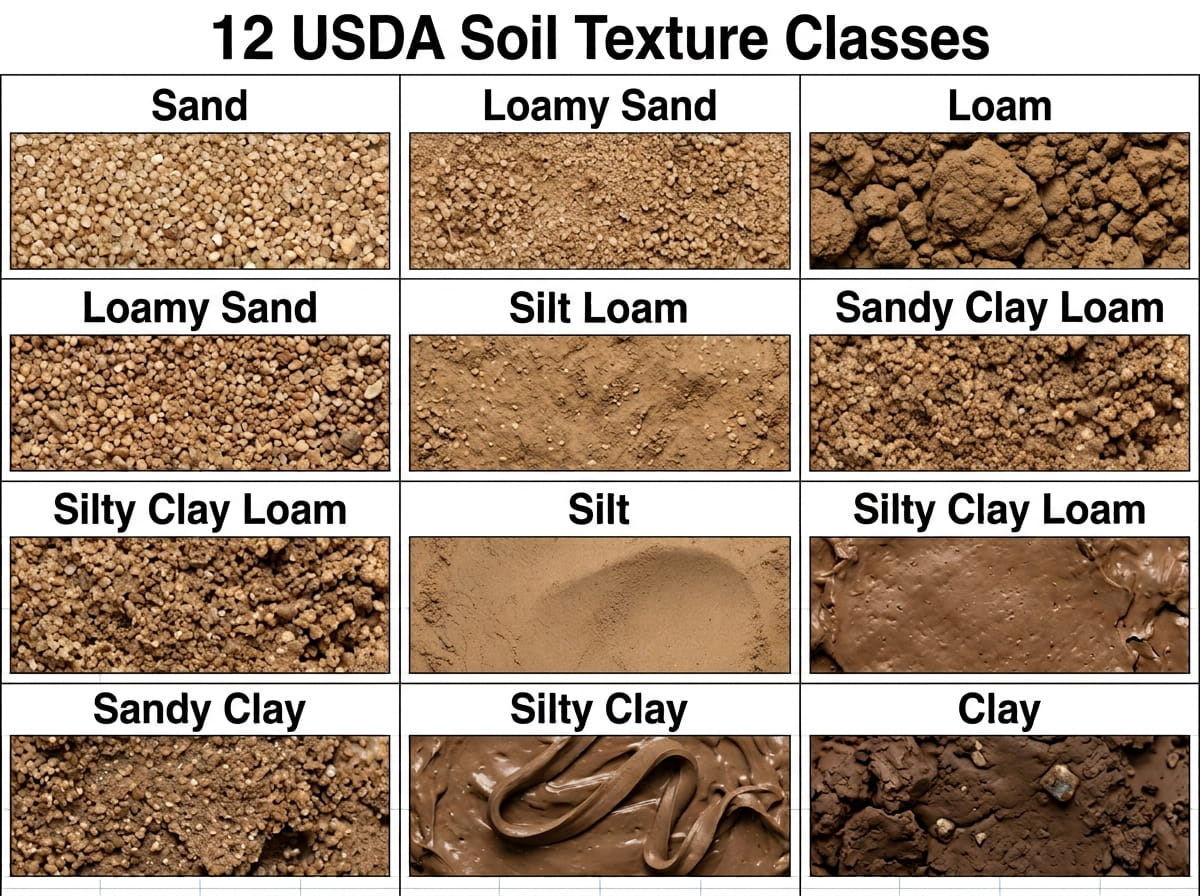
The 12 USDA soil texture classes occupy distinct regions of the texture triangle. Medium-textured classes such as loam are often useful for crop and garden applications, but suitability depends on site conditions and management.
Common Soil Texture Triangle Mistakes
- Percentages do not total 100%: Sand + silt + clay should equal 100% for the sample being classified.
- Using rectangular percentage ranges: USDA classes are defined by triangular boundaries, so a three-column range table cannot replace the triangle.
- Reading the wrong axis: Check which side represents sand, silt, and clay before plotting.
- Confusing texture with fertility: Texture affects physical behavior, but fertility also depends on nutrients, pH, organic matter, mineralogy, salinity, and other properties.
- Confusing USDA texture with engineering classification: Use appropriate geotechnical testing and classification for construction decisions.
- Treating a jar test as laboratory analysis: A home sedimentation test is an estimate and should not be presented as equivalent to a laboratory particle-size analysis.
How to Test Your Soil for Texture
Method 1: Laboratory Particle Size Analysis (Most Accurate)
Soil testing laboratories use mechanical sieving and pipette analysis to measure particle sizes with precision.
How it works:
- Send your soil sample to a lab (usually 1–2 cups of soil).
- The laboratory prepares and disperses the sample according to its analytical method; pretreatment can vary with soil properties and the test protocol.
- Sample is run through a sedimentation tube using a hydrometer.
- Sand is separated by sieving.
- Silt and clay percentages are determined by sedimentation rate.
- Lab provides a detailed report with exact percentages.
Accuracy: Laboratory results are generally more reliable than field estimates, but precision depends on the analytical method, sample preparation, laboratory procedures, and reporting.
Cost: Varies by laboratory, location, and test package.
Time: Varies by laboratory.
Best for: Decisions where a documented, more controlled particle-size analysis is needed. Engineering projects may require additional geotechnical tests beyond soil texture.
Method 2: Jar Sedimentation Test — Rough Estimate
A clear-jar sedimentation test can help visualize differences in settling behavior, but it is a rough estimate, not a laboratory hydrometer analysis. Settling depends on particle size, particle shape, dispersion, water properties, organic matter, and how completely the sample has been dispersed.
What you need:
- A clear jar with a lid
- A representative soil sample
- Water
- A ruler or measuring tape
- A suitable dispersing agent if the method you are following calls for one
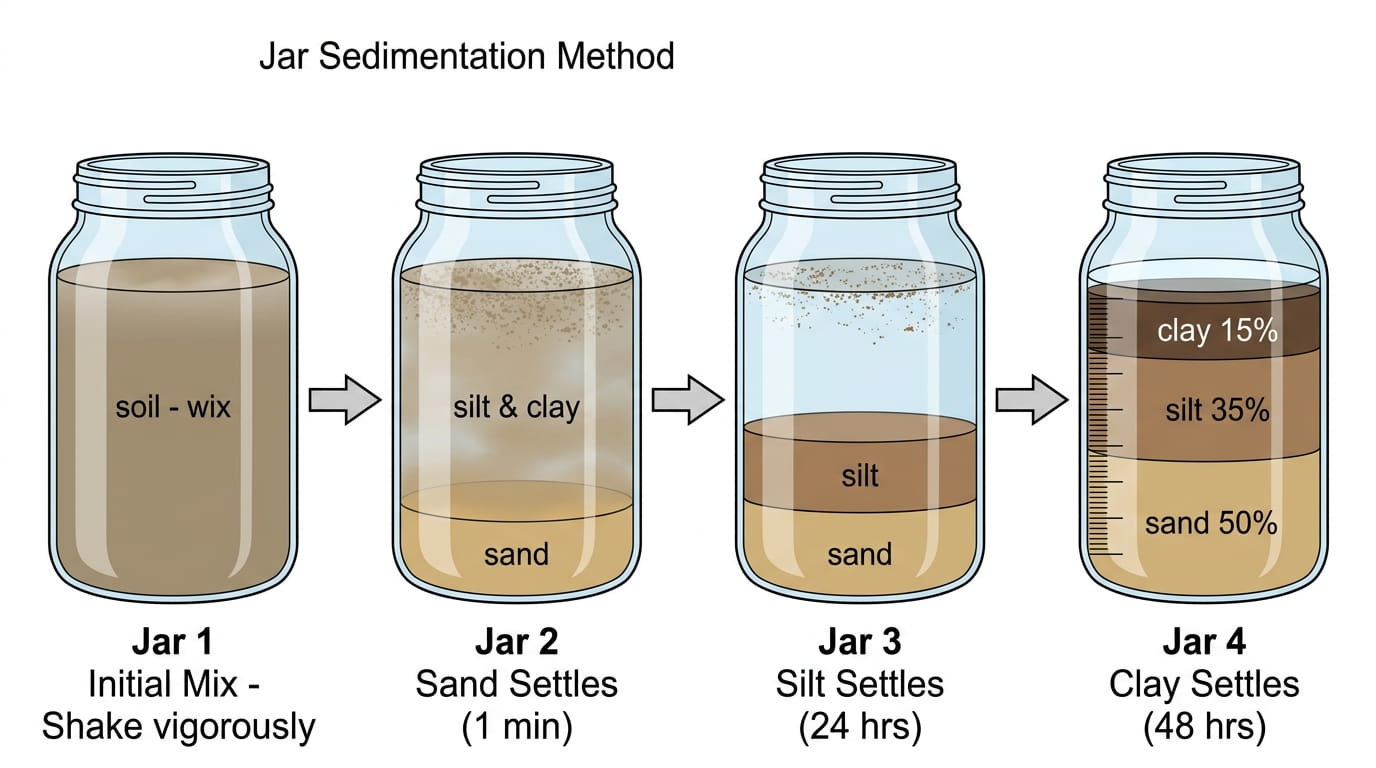
The jar sedimentation test separates soil particles by settling time. Sand settles in 1 minute, silt in 24 hours, and clay remains suspended beyond 48 hours.
Basic procedure:
- Break up clods and remove obvious roots, stones, and other coarse fragments from the portion being tested.
- Place the prepared soil in the jar and add water.
- Close the jar and shake thoroughly so the soil is dispersed into suspension.
- Set the jar on a level surface and observe how the suspended material settles over time.
- Record the visible layers if they become distinct. Sand generally settles first, while finer particles remain suspended longer.
Important: Do not convert layer heights into an exact USDA texture class without understanding the limitations of the test. A jar test can support a rough estimate, but laboratory analysis is preferable when the classification will affect a significant agricultural, land-management, or engineering decision.
Cost: Usually low if basic household materials are available.
Best for: Learning and rough field/home estimates.
Method 3: Feel Test (Field Method)
Experienced soil scientists can estimate texture by feel. It requires practice but works in the field without equipment.
Steps:
- Moisten a pinch of soil with water until it’s moldable.
- Roll it between your palms into a ball.
- Try to form a ribbon by pushing soil out between your thumb and forefinger.
- Judge stickiness, grittiness, and how long the ribbon is.
Texture clues:
- Gritty, doesn’t hold together: Sandy soil
- Smooth, forms short ribbon (less than 1 inch): Loamy soil
- Very sticky, forms long ribbon (more than 2 inches): Clay soil
Accuracy: Highly dependent on the user’s training, soil condition, moisture content, and field procedure. Treat it as an approximate field classification rather than a fixed-percentage measurement.
Cost: Free
Time: 2 minutes
Best for: Quick field estimates, learning, rule-of-thumb decisions.
Frequently Asked Questions
What is the USDA soil texture triangle used for?
The USDA soil texture triangle classifies mineral soil according to the relative proportions of sand, silt, and clay. It assigns one of 12 basic texture classes. Texture strongly influences water movement, water-holding capacity, aeration, and workability, but it is not a complete measure of fertility and it is not a substitute for engineering soil classification.
How accurate is the jar method for soil texture?
A jar sedimentation test is a rough estimate and does not have a universal percentage-accuracy figure. Results depend on sample preparation, dispersion, particle properties, and how the layers are measured. For decisions requiring more reliable particle-size data, use a laboratory analysis.
Can you change soil texture?
No. Soil texture is determined by the mineral composition left by geological weathering. It cannot be changed significantly. You can improve soil structure (aggregation) and fertility through amendments (compost, manure), but the underlying percentages of sand, silt, and clay remain constant. This is why understanding your soil’s texture is so important—it’s a permanent characteristic you must work with.
What is the ideal soil texture for gardening?
Loam is often well suited to many gardens and crops because it provides a relatively balanced combination of drainage and water retention. However, the best soil texture depends on the crop, climate, drainage, organic matter, structure, and management. Adding organic matter can improve soil structure and water management, but it does not change the underlying sand, silt, and clay percentages in a meaningful way.
Why do clay soils become waterlogged while sandy soils dry out quickly?
Fine-textured soils generally contain more small pores and tend to retain more water, while coarse-textured soils have larger pores and generally transmit water more quickly. Actual drainage also depends on soil structure, compaction, organic matter, layering, and landscape position, so texture alone does not determine whether a site will become waterlogged.
How often should you test your soil texture?
Soil texture is generally a stable property and usually does not need to be measured as frequently as dynamic properties such as pH, nutrients, or soil moisture. Retest when there has been substantial soil movement, mixing, erosion, imported material, or another change that could alter the material being assessed.
Is it better to use a calculator or plot the triangle by hand?
Use a calculator for accuracy and speed. Hand plotting is educational and helps you understand the method, but it’s slow and prone to error if you’re testing many samples. Our Soil Texture Classifier handles the math instantly and provides additional data (water-holding capacity, drainage rates) based on your texture class.
What does “silt loam” mean, and how is it different from “loamy sand”?
Silt loam and loamy sand are different USDA texture classes located in different parts of the texture triangle. Silt loam is dominated by silt and generally has greater water-holding capacity than loamy sand, while loamy sand has a stronger sand influence and generally drains more quickly. Use the USDA triangle rather than memorized rectangular percentage ranges to determine the exact class.
Understanding Your Soil’s Texture Is the First Step
Soil texture classification becomes much easier once you understand how the USDA triangle relates sand, silt, and clay percentages to the 12 texture classes. The key is to use the actual triangle boundaries rather than treating each class as a simple three-column percentage range.
Texture is useful for understanding water movement, water-holding capacity, aeration, workability, and plant-soil interactions. For important land or engineering decisions, combine texture information with the other soil and site data required for the decision.
For a quick classification, enter your measured sand, silt, and clay percentages in our Soil Texture Classifier. If the decision is high-stakes or the percentages are uncertain, consider a laboratory analysis.
References
- USDA Natural Resources Conservation Service. Soil Texture Calculator. Official NRCS resource
- USDA Natural Resources Conservation Service. Soil Survey Manual, Chapter 3: Examination and Description of Soils. Official USDA-NRCS manual
- USDA Natural Resources Conservation Service. National Agronomy Manual, Part 508: Soils. Official USDA-NRCS manual
- USDA Natural Resources Conservation Service. Part 652 Irrigation Guide, Chapter 2: Soils. Official USDA-NRCS guide
- Brady, N. C., & Weil, R. R. The Nature and Properties of Soils. Pearson Education.
- Tan, K. H. Soil Sampling, Preparation, and Analysis. CRC Press.

Nouman Ahmed, a Civil Engineer with practical experience in solar energy system design, engineering calculations, electrical systems, and engineering software development. Since 2011, he has been involved in residential and commercial solar energy projects, helping design practical PV solutions and technical calculation tools.
Nouman is the founder of Solvebility, an engineering resource dedicated to publishing accurate, transparent, and easy-to-use online calculators covering renewable energy, electrical engineering, construction, mathematics, finance, health, and other technical disciplines.